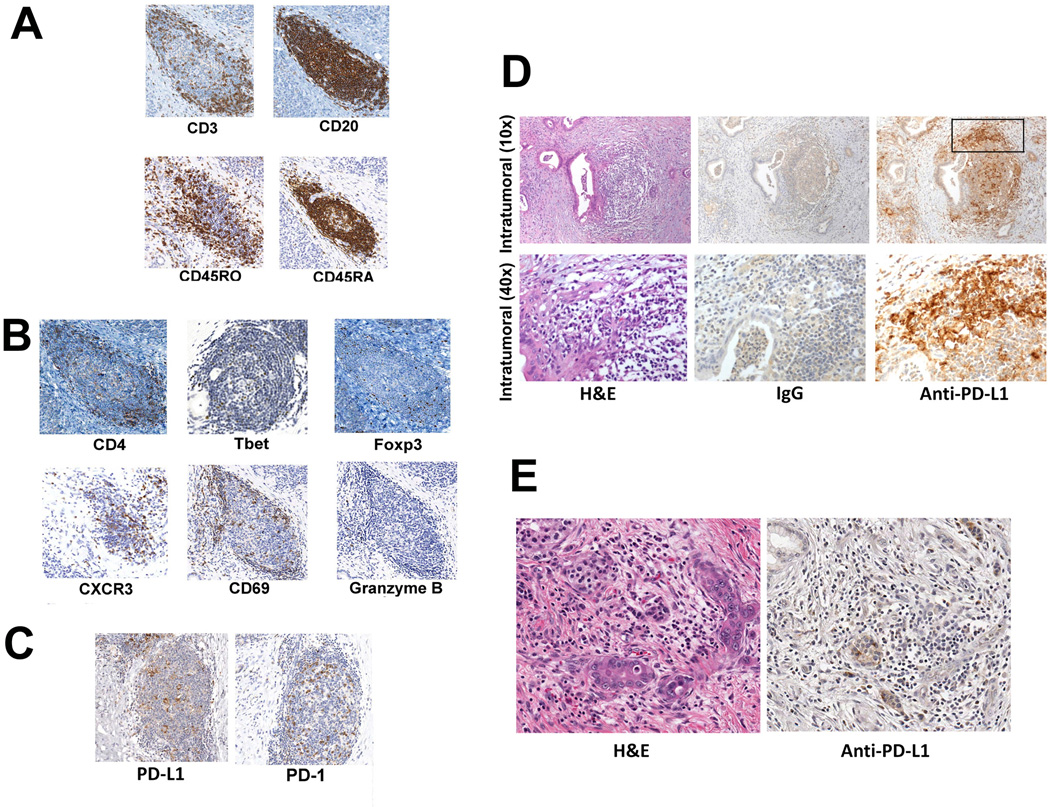
Figure 2. Intratumoral lymphoid aggregates are sites of post-vaccination T-cell activation and regulation.
A. IHC analysis of CD3-, CD20-, CD45RO-, and CD45RA-expressing cells. B. IHC analysis of CD4-, T-bet-, Foxp3-, CXCR3-, CD69-, and Granzyme B-expressing cells (Granzyme B+ cells are indicated by arrows). C. IHC analysis of B7-H1/PD-L1- and PD-1-expressing cells. D. PD-L1 expression in a representative intratumoral lymphoid aggregate from a vaccinated patient. The square indicates the edge of the intratumoral lymphoid aggregate that is shown in the bottom panels at a higher magnification. Brown staining indicates expression of the indicated markers. E. Absence of PD-L1 expression in a representative PDAC specimen from an unvaccinated patient.

