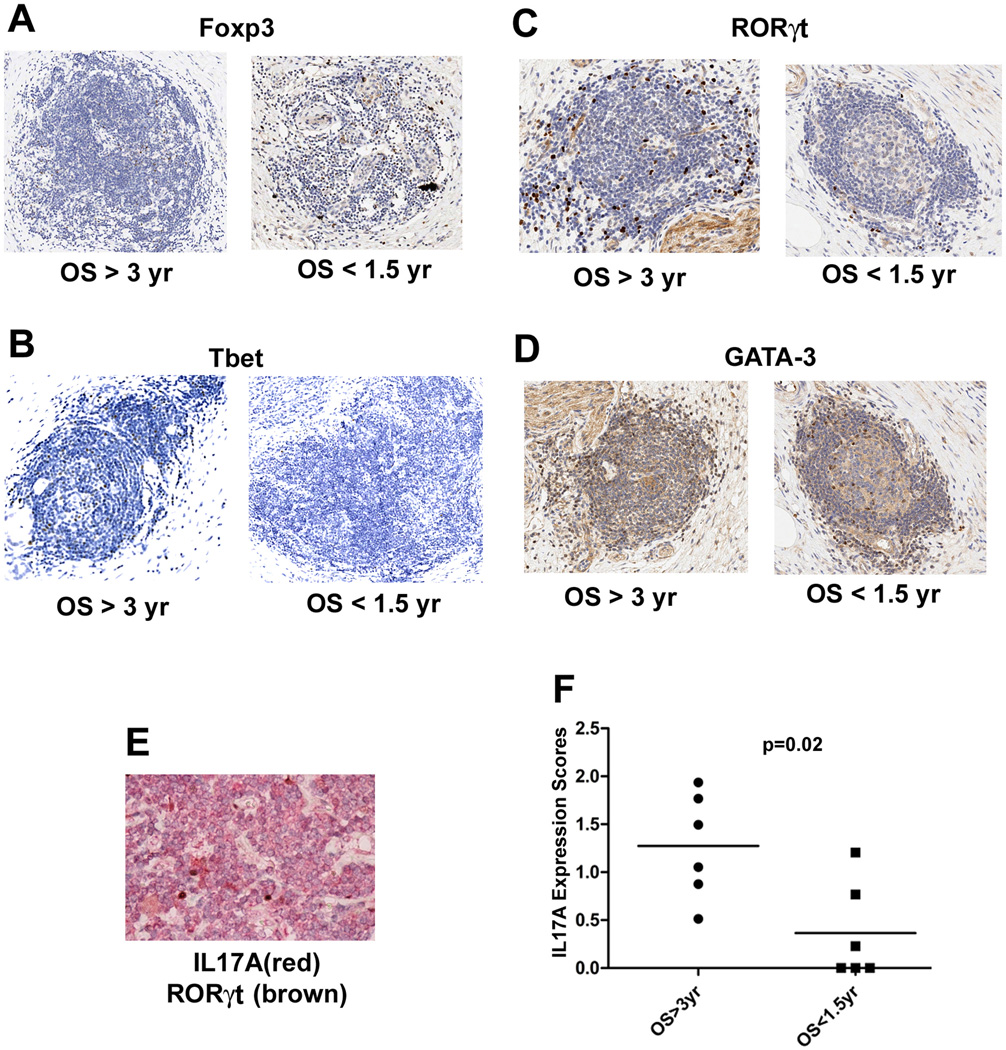
Figure 6. In situ expression of signature genes in the Th1, Th2, Th17 and Treg pathways.
A. Anti-Foxp3 antibody staining for Tregs. B. Anti-T-bet staining for Th1 cells. C. Anti-RORγt staining for Th17 cells. D. Anti-GATA-3 staining for Th2 cells. For each target, one representative lymphoid aggregate from a patient with OS > 3 years and one from a patient with OS < 1.5 years is shown. All positive signals are in brown. E. Co-staining of IL17A (in red) and RORγt (in brown) in a representative lymphoid aggregate. F. Cumulative IL17 signals for all intratumoral lymphoid aggregates for each patient’s tumor section analyzed were quantified using Image Analysis Software (Aperio) and the expression levels were compared between patients with OS > 3 years (n=6) and OS < 1.5 years (n=6). Medians and the p value calculated using the Wilcoxon signed rank test are shown.

