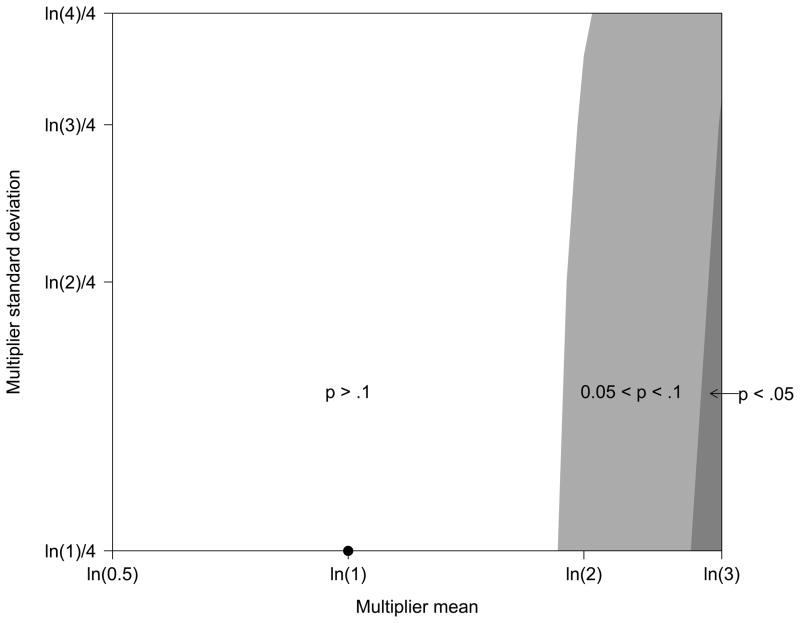
Figure 1.
Contour plot for the p-values of the treatment effects in Table 5 showing the regions where the treatment was significant (dark gray), marginally significant (light gray), or non-significant (white) according to a given pair of multiplier means and standard deviations. The point plotted at (ln(1), ln(1)/4) corresponds to a MAR with no uncertainty assumption.

