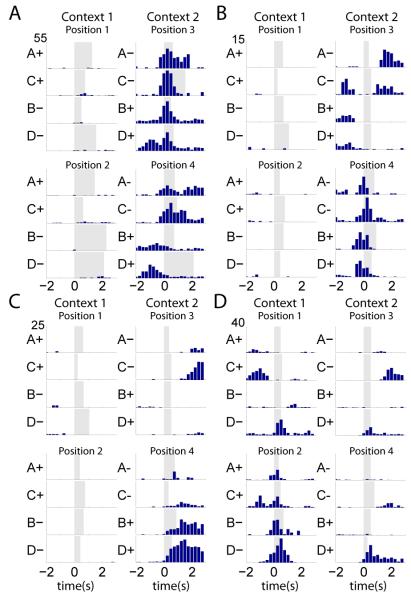
Figure 2.
Peri-event time histograms (PETHs) centered on the onset of item sampling of example cells for the four items presented within each position. Y-axis is the trial average firing rate (Hz; scale at upper left for each cell). Grey shading indicates the minimum sampling period. See also Figure S4 for histological confirmation of recording sites.

