
Figure 4.
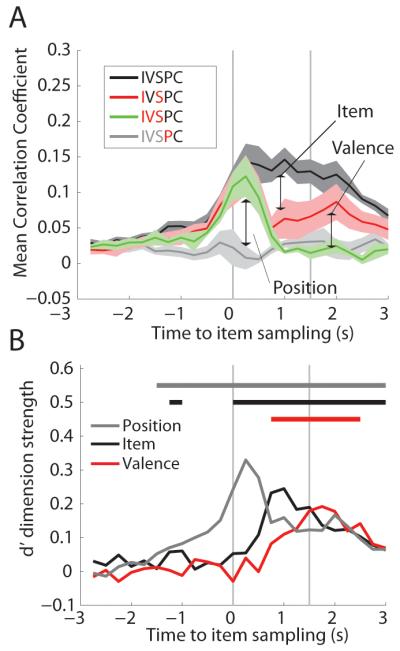
During item sampling, position is coded first, followed by item, and finally valence. (A) The ensemble correlation analyses was done using the population firing rates taken from 250ms bins centered around sampling for trials in the same location. Sampling epochs shorter that 1.5s were excluded. IVSPC defined in Table 1. Mean of each rat’s average correlation coefficient is plotted with S.E.M. (N = 5). (B) The average d’ for item (black) and valence (red) and position (grey) for trials in the same position. Color coded bar above graph shows periods in which that dimension was significantly coded.