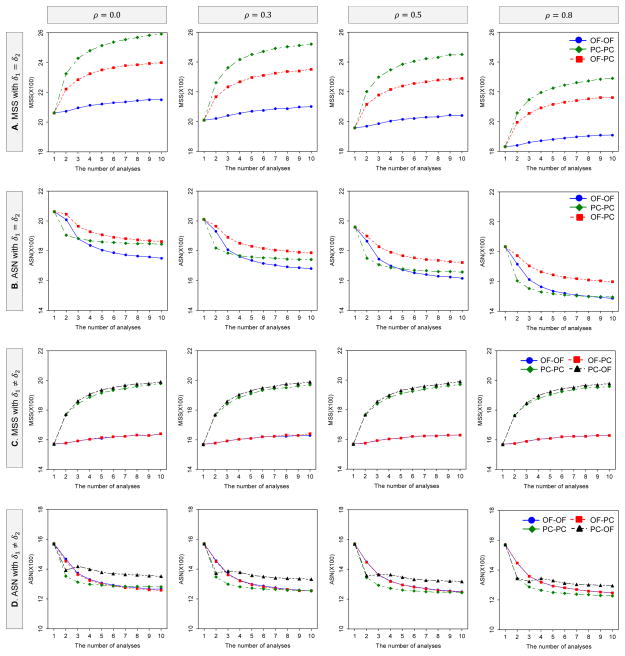
Figure 1.
Behavior of MSS and ASN for DF-1 as the number of analyses and boundaries vary. The MSS and ASN per intervention group (equally-sized groups: rl=1) were calculated to detect the joint difference in the two endpoints with the overall power of 80% at the one-sided significance level of 2.5%, where δ1 = δ2 = 0.1 for A and B, and δ1 = 0.1 and δ2 = 0.2 for C and D; . When differences between means are equal, the and critical values are determined by the three boundary combinations, i.e, (i) the OF for both endpoints, (ii) the PC for both endpoints and (iii) the OF for δ1 and the PC for δ2, with the LD alpha-spending method with equal information space. When differences between means are unequal, in addtion to the three combinations, (iv) the PC for δ1 and the OF for δ2 is considered.

