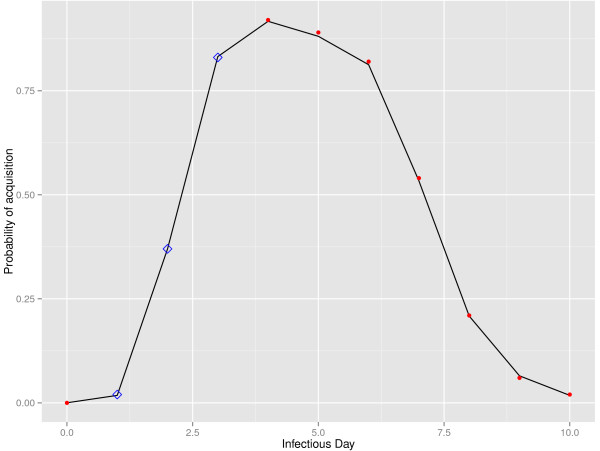
Figure 2.

Extrapolated fit of probability of acquisition. The distribution of acquisition over infectious day (ID) given the relationship between infectious day and circulating viremia from [20]. Red dots are data points from [20], blue squares are the extrapolated points of acquisition for ID1-3 based on the curve fit (black line).
