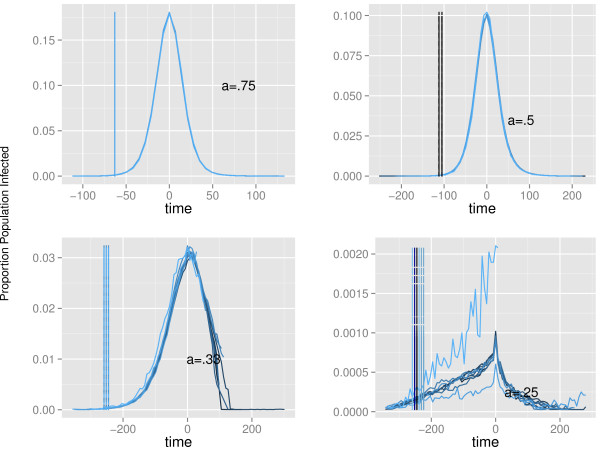
Figure 4.

Proportion of population infected. The proportion of the population infected (y-axes) plotted against centered time (x-axes) for contact rates a = [.25-.75] and each day of introduction relative to the index case infectious day (ID). Vertical lines indicate the time of detection relative to peak cases at t = 0.
