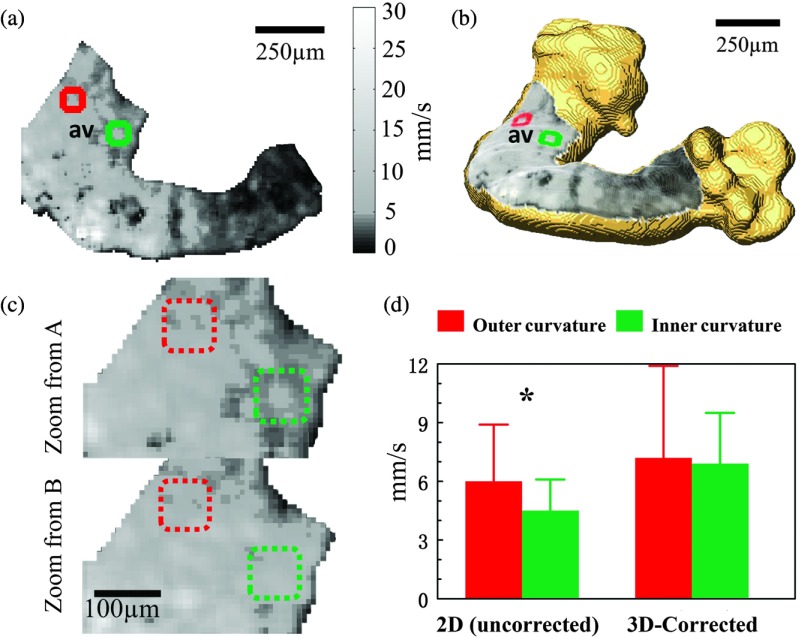
Fig. 7.
Panels (a) and (b) are 2-D (uncorrected) and 3-D-corrected conduction velocity maps, respectively, for embryonic heart 1. Square regions of interest from the right (indicated in green) and left (indicated in red) sides were selected for comparison. Panel (c) top and bottom are magnified, corresponding images of the AVJ from panels (a) and (b). Panel (d) shows the conduction velocity () computed from 109 pixels of each marked region in panel (c). Conduction velocity values were compared using Student’s -test (* significant). av- atrioventricular junction.

