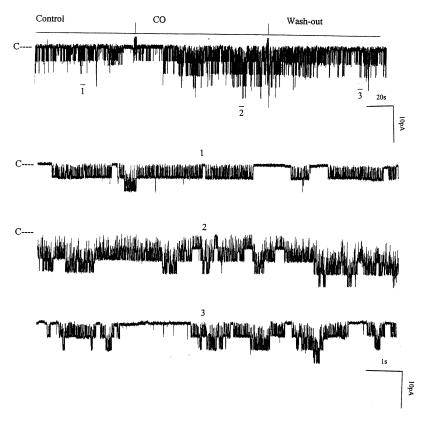
Figure 10.
The experiment was performed in an inside-out patch to demonstrate the effect of 100 μM CO on the channel activity. The top trace shows the time course of the experiment. Three parts of the trace, indicated by numbers 1–3, are extended to demonstrate the detail of channel activity. The pipette holding potential was 0 mV.

