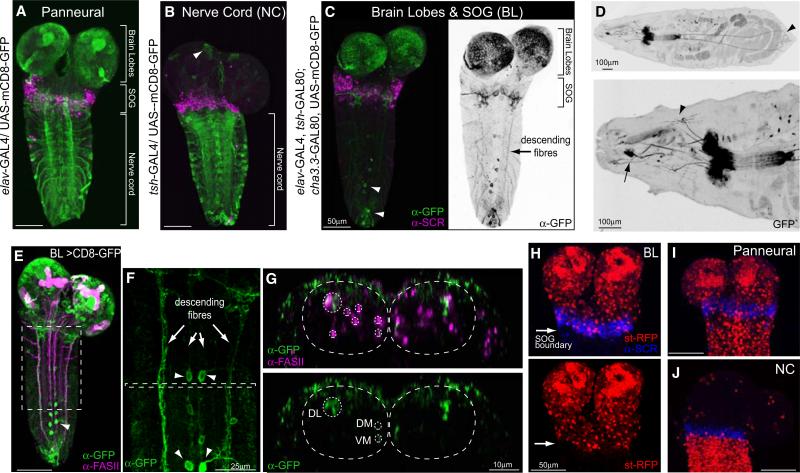
Figure 1. Driver Lines to Manipulate the Activity of Distinct Regions of the Nervous System.
(A–C) Expression patterns of the driver lines in the CNS of early third-instar larvae were assessed with UAS-mCD8-GFP and immunostaining with anti-GFP and anti-SCR antibodies. SCR labels the most posterior (labial) segment of the subesophageal ganglion. (A) The panneural driver line elav-Gal4. (B) The nerve cord (NC) driver line tsh-GAL4. (C) A driver line for the brain lobes, SOG, and descending neurons, called BL-Gal4, was generated by the combination of elav-Gal4 with two Gal80 repressor lines, one expressed in the NC, tsh-GAL80, and one in sensory neurons, cha3.3-GAL80. GFP expression is restricted to neurons located in the brain lobes and SOG. Descending fibers are labeled (arrow). A few scattered motorneurons in abdominal segments as well as a group of neurons in abdominal segment 9 (A9) are labeled (arrow head).
(D) GFP expression in a whole larva. Upper panel shows that most sensory neurons are excluded from the BL expression pattern. A group of neurons in A9 send processes to the anal plate (arrow head). Lower panel shows that a few anterior sensory neurons are seen in the BL expression pattern. These include a pair of multidendritic neurons (arrow head) and the Bolwig organs (arrow).
(E–G) Double staining with FasII to assess the positioning of the descending fibers. (E) Projection of whole CNS. (F) Inset from e showing descending fibers (arrows) and a few motoneurons (arrow heads). (G) Transverse view of inset from (F). The upper panel shows the FasII positive tracts, marked with a dashed line, as well as BL descending fibers. The lower panel shows that the BL neurons descend in the DL, DM, and VM tracts.
(H–J) Images showing boundaries of the driver lines. (H) Upper and lower panels show BL > st-RFP; RFP expression is confined to the brain lobes and SOG. Anti-SCR marks posterior boundary of expression. (I) elav > st-RFP. Expression levels in the brain were similar in the panneural and BL lines. (J) NC > st-RFP. Expression is confined to the region posterior to the SOG marked by anti-SCR. An average of 9 elav-Gal4, 18 BL-Gal4, and 9 NC-Gal4 animals was analyzed for each panel.

