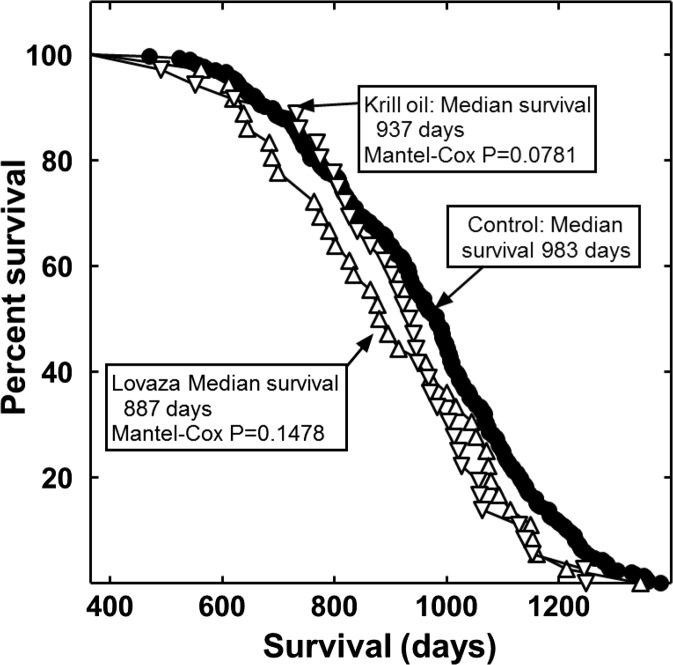
Fig. 1.
Life span of mice fed a control diet or a diet supplemented with Lovaza or krill oil. Shown are the life spans of the control (filled circles), krill oil-treated mice (downward-pointing triangles), and Lovaza-treated mice (upward-pointing triangles). The percentage of mice remaining alive at the end of each time period shown is plotted. The controls began with 297 mice and the treatment groups with 36 mice each. The graph begins at 365 days of age, when treatments were started

