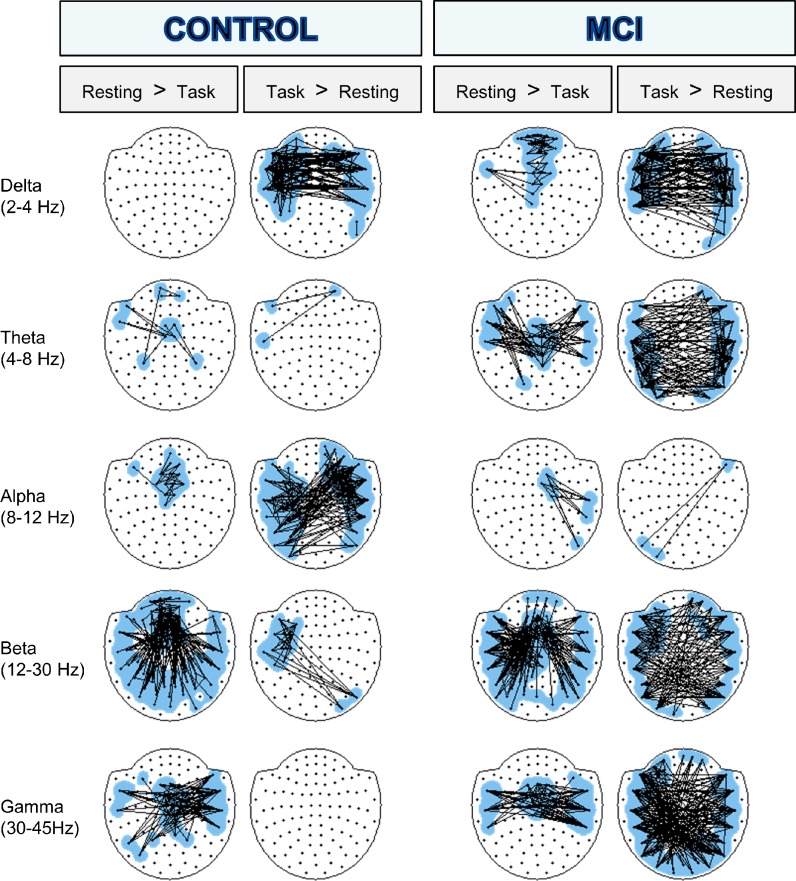
Fig. 2.
Statistical differences in connectivity between resting and 3-substraction task for controls and MCIs. Significantly altered links (p < 0.005) are shown for every frequency band. A line between two nodes represents a link that has been significantly altered and is either decreased (resting > task) or increased (task > testing) in the 3-substraction task. For clarity in visualization, only a selection of links was displayed: firstly, in order to reduce loose links, nodes participating with a single significant link were discarded, and secondly, a maximum of 150 links was plotted (if more links were statistically significant, 150 links with the lowest p value were chosen)

