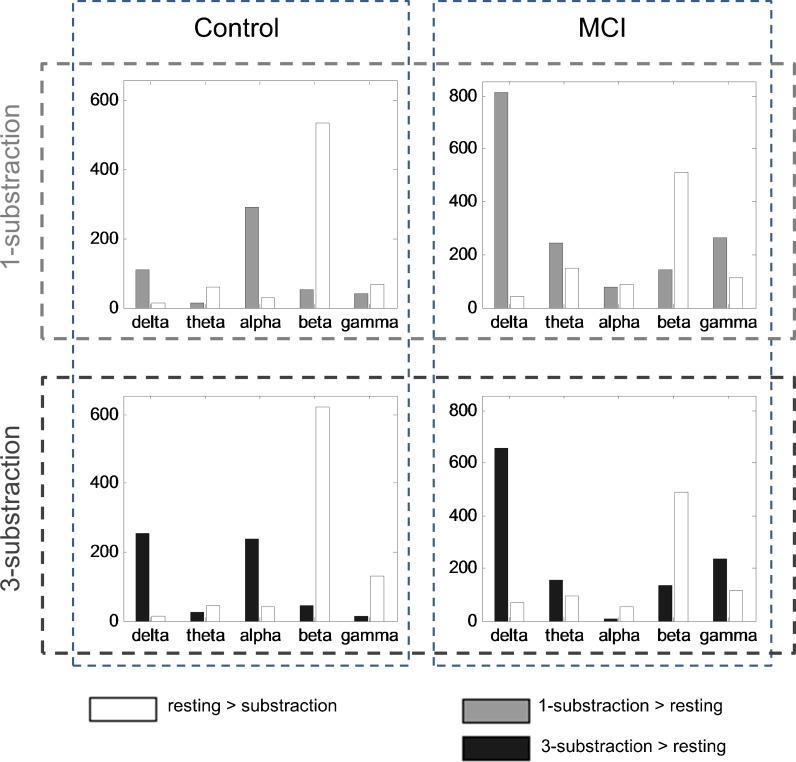
Fig. 3.
Number of significantly altered links when comparing resting and task for different groups and frequency bands. The first row shows differences between 1-substraction task (gray) and resting state (white), the second row considers 3-substraction (black) and resting. The two groups (controls and MCIs) are represented in different columns. Only links with p < 0.005 were considered

