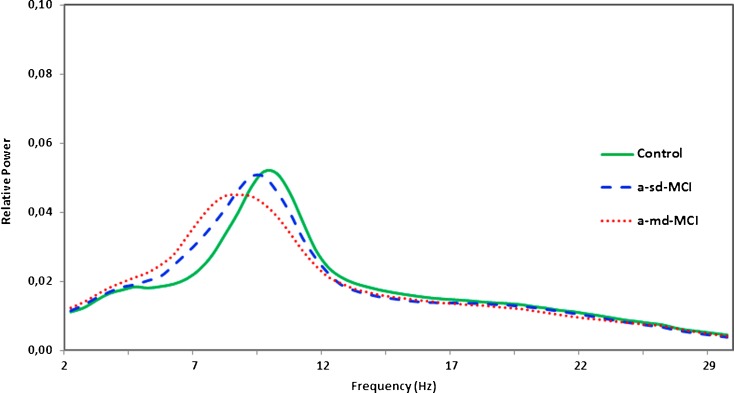
Fig. 2.
Average relative power spectra for all channels in the control group (green line), the a-sd-MCI group (blue dashed line), and the a-md-MCI group (red dotted line). Spectra are represented in the “x” axis from 1 to 30 Hz frequency band and relative power values in the “y” axis. It is very important to point out for the reader that, in all figures, the red color represents the a-md-MCI group, the blue color represents the a-sd-MCI group and the green color represents the control group

