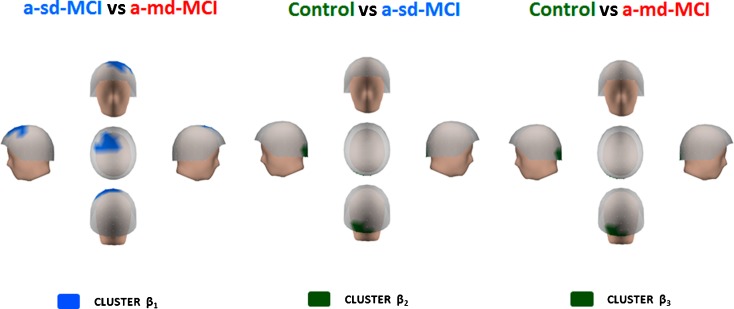
Fig. 7.
Differences within the beta band range. Blue color indicates that the a-sd-MCI group exhibited increased relative power in a fronto-central cluster (cluster β 1) as compared with a-md-MCI. In the control group, there is an increased of relative power, indicated in green color, in occipital areas (clusters β 2 and β 3) when compared with a-sd and a-md-MCI groups

