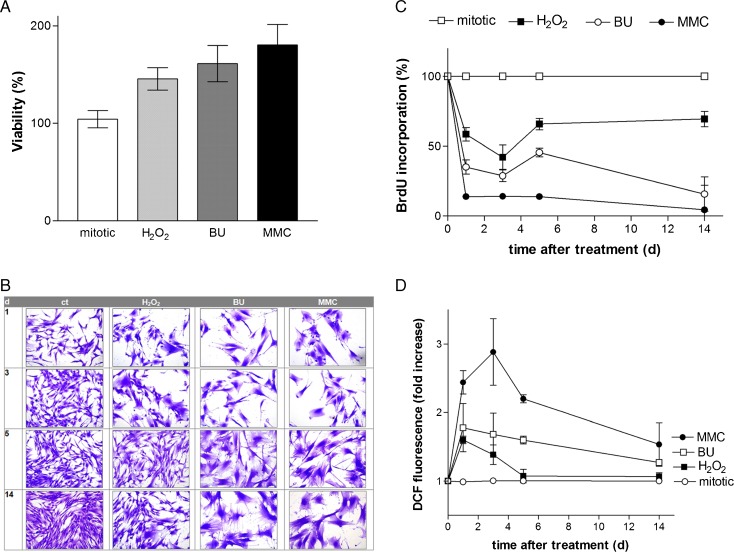
Fig. 1.
a Cytotoxicity of senescence-inducing substances. Subconfluent human dermal fibroblasts (passages 2–15) were incubated with H2O2 (150 μM; 2 h), busulfan (BU; 120 μM; 24 h), and mitomycin C (MMC; 200 nM; 2 × 24 h) at 37 °C and 5 % CO2 in a fibroblast growth medium (DMEM, 10 % FCS, 100-IU/ml penicillin, 100-μg/ml streptomycin). The percentage of living cells was measured 5 days after treatment using MTT assay. The results were presented as a percentage of mock-treated control which was set at 100 %. The experiments were performed in three independent experiments. The data represent the mean ± s.e.m. of three independent experiments. b Morphological changes of cell structure. Subconfluent fibroblasts (passages 2–15) were incubated with H2O2 (150 μM; 2 h), busulfan (BU; 120 μM; 24 h), and mitomycin C (MMC; 200 nM; 2 × 24 h) at 37 °C and 5 % CO2. After 1, 3, 5, and 14 days, the cells were fixed with 4 % formaldehyde (Roth) and stained with Coomassie Brilliant Blue (Merck). The experiments were performed in three independent experiments, and representative images were shown. Magnification is 40-fold. c Proliferation of mitotic and senescent fibroblasts. Subconfluent fibroblasts (passages 2–15) were incubated with H2O2 (150 μM; 2 h), busulfan (BU; 120 μM; 24 h), and mitomycin C (MMC; 200 nM; 2 × 24 h) at 37 °C and 5 % CO2 in a fibroblast growth medium. The proliferative capacity was measured at days 1, 3, 5, and 14 after treatment with the BrdU assay kit (Merck) in comparison to mitotic fibroblasts which were used as control (ct) and set to 100 %. The data represent the mean ± s.e.m. of three independent experiments. d Time course analysis of the ROS production. Subconfluent fibroblasts (passages 2–15) were treated with H2O2 (150 μM; 2 h), busulfan (BU; 120 μM; 24 h), or mitomycin C (MMC; 200 nM; 2 × 24 h) at 37 °C and 5 % CO2 in a fibroblast growth medium. Subsequently, the intracellular ROS level was determined 1, 3, 5, and 14 days after treatment using the DCF measurement. The data represent the mean ± s.e.m. of three independent experiments. The ROS level represents the fold increase over control, which was set at 1

