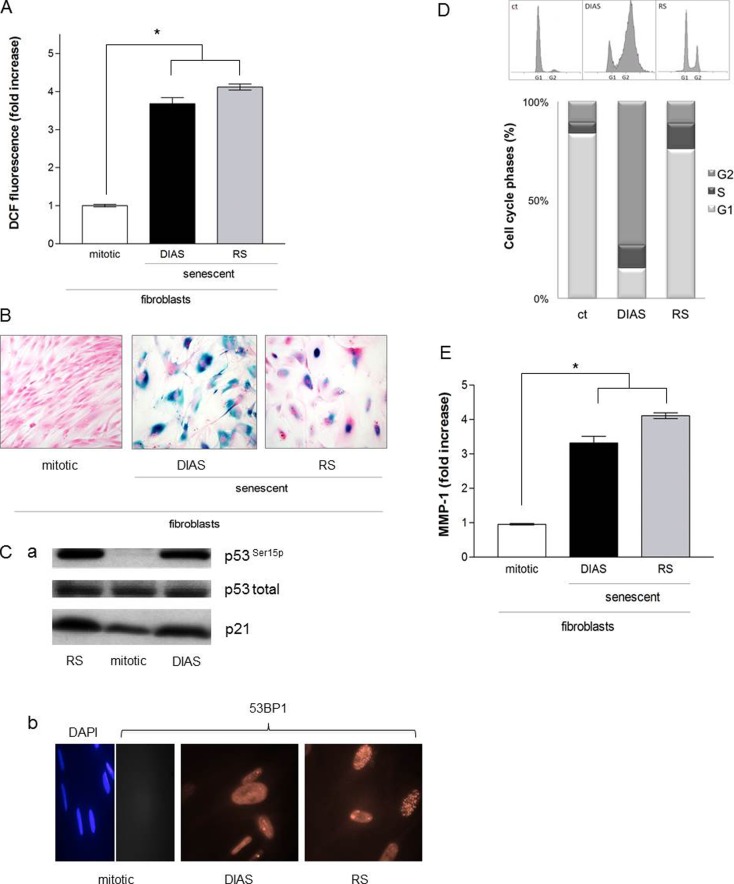
Fig. 3.
a Reactive oxygen species in senescent cells. Subconfluent fibroblasts (passages 2–15) were treated with MMC (DIAS; 200 nM; 2 × 24 h) at 37 °C and 5 % CO2 in a fibroblast growth medium. The intracellular ROS level was measured 5 days after treatment in comparison to replicative senescence cells (RS; passages 55–60). Mock-treated, mitotic fibroblasts were used as control (ct). The ROS level represents the fold increase over control, which was set to 1. The data represent the mean ± s.e.m. of three independent experiments (*p < 0.05; one-way ANOVA). b SA-ß-galactosidase activity in senescent fibroblasts. Subconfluent fibroblasts (passages 2–15) were incubated with MMC (DIAS; 200 nM; 2 × 24 h) at 37 °C and 5 % CO2 in a fibroblast growth medium, and the SA-ß-galactosidase activity was measured 21 days after treatment in comparison to replicative senescent cells (RS). Mock-treated, mitotic fibroblasts were used as control (ct). Representative images of three independent experiments are shown. Magnification is 40-fold. c (a) p53 in senescent fibroblasts. Subconfluent fibroblasts were incubated with MMC (200 nM, 2 × 24 h, DIAS) at 37 °C and 5 % CO2 in a fibroblast growth medium, and phosphorylation of p53 was examined in comparison to replicative senescence cells (RS; passages 55–60). Mock-treated, mitotic fibroblasts were used as control (ct). The level of phosphorylated and total p53 and p21 was determined by Western blot, and representative blots are shown. (b) Formation of 53BP1 foci in senescent fibroblasts. Subconfluent fibroblasts (passages 2–15) were treated with MMC (DIAS; 200 nM; 2 × 24 h) at 37 °C and 5 % CO2 in a fibroblast growth medium. The 53BP1 staining was performed 5 days after treatment in comparison to replicative senescence cells (RS; passages 55–60). Mock-treated, mitotic fibroblasts were used as control (ct). Cells were stained for 53BP1 expression with a polyclonal antibody followed by incubation with an Alexa 546-coupled secondary antibody (red). Nuclei of control cells were visualized with 4′,6′-diamidin-2-phenylindol (DAPI; blue). Images were acquired by fluorescence microscopy. Representative images of two independent experiments are shown. Magnification is 40-fold. d Cell cycle regulation in senescent fibroblasts. Subconfluent fibroblasts (passages 2–15) were treated with MMC (DIAS; 200 nM; 2 × 24 h) at 37 °C and 5 % CO2 in a fibroblast growth medium. The cell cycle phases were analyzed 5 days after treatment in comparison to replicative senescence cells (RS; passages 55–60). Mock-treated, mitotic fibroblasts were used as control (ct). Cells were fixed with ice-cold methanol, and cell cycle phases were analyzed with flow cytometry by staining with propidium iodide. Untreated mitotic fibroblasts (ct) served as control. Shown are representative histograms of three independent experiments (n = 3) and the mean values of the percentage distribution of the cell cycle phases (*p < 0.05, one-way ANOVA). e Release of pro-MMP-1 of fibroblasts. Subconfluent fibroblasts (passages 2–15) were incubated with MMC (DIAS; 200 nM; 2 × 24 h) at 37 °C and 5 % CO2 in a fibroblast growth medium, and 5 days after treatment, the concentration of extracellular MMP-1 was measured by ELISA in comparison to replicative senescence cells (RS; passages 55–60). Mock-treated, mitotic fibroblasts were used as control (ct). Concentration of Pro-MMP-1/cell presents the fold increase over control, which was set to 1. The data represent the mean ± s.e.m. of three independent experiments (*p < 0.05; one-way ANOVA)

