
Figure 1.
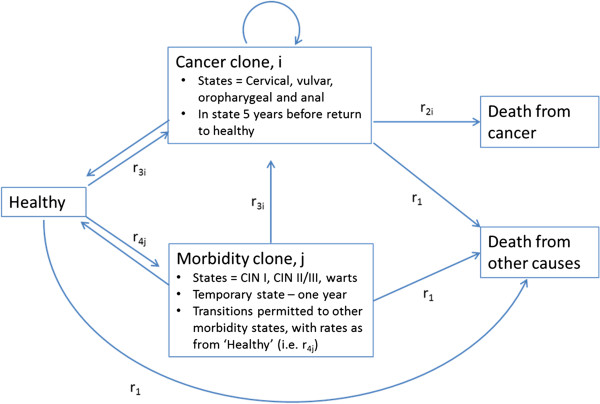
Stylized Markov model for HPV-related disease states. r1 = rates of all-cause mortality from population lifetables, by sex, age, ethnicity (Māori, non-Māori) and area deprivation (approximate tertiles), and projected to future. Source: [22]. r2i = excess mortality rates of death from cancer i, by sex, age, ethnicity and deprivation, and by time since diagnosis. Source: [23] r3i = incidence rates for cancer i, by sex, age, ethnicity and deprivation. Source: [24] r4j = incidence rates for morbidity states j, by sex and age (and ethnicity for CIN I, CIN II/III and anogenital warts). Source: [20].