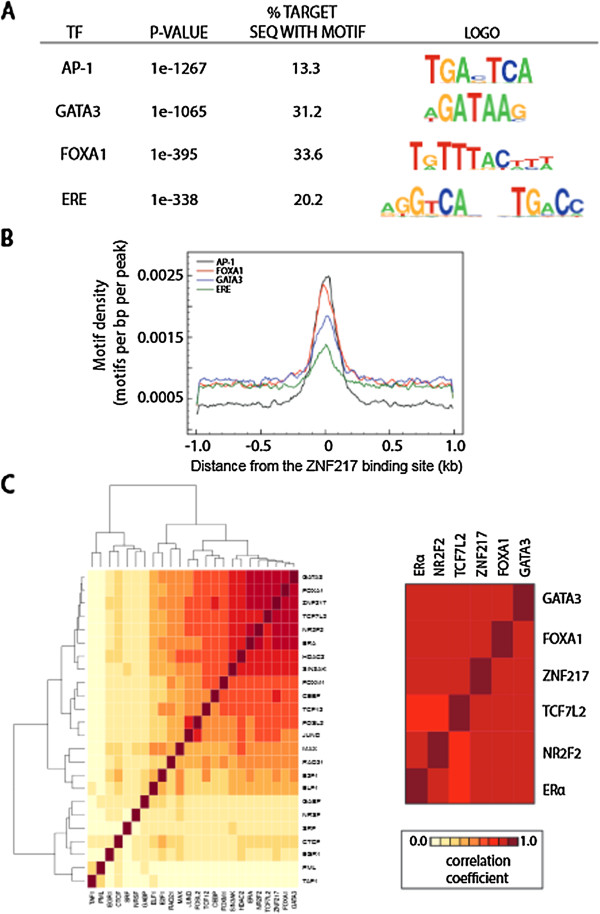
Figure 2.

ZNF217 binding sites cluster with transcription factor binding sites in MCF7 cells. (A) Top TF motifs enriched in ZNF217 binding sites. (B) Distribution of identified motifs relative to the center of ZNF217 binding sites. Shown below are the motif logos for each TF. (C) ZNF217 shows co-binding with GATA3, FOXA1, TCF7L2, NR2F2 and ERα. Colors in the heat map reflect the colocalization frequency of each transcription factor (the descending frequency of localization ranges from red to yellow to white).
