
Figure 3.
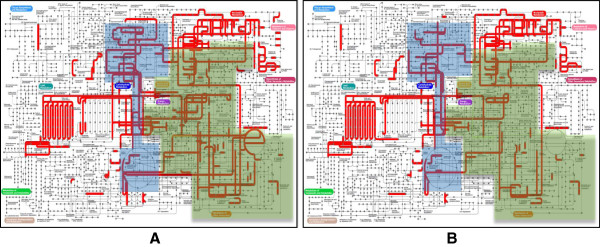
Metabolic capacities of L. delbrueckii ssp. lactis CNRZ327 and L. delbrueckii ssp. bulgaricus ATCC 11842. Metabolic pathway analysis was performed using KEGG [12, 13]. Graphs were generated using ipath [14]. A, L. delbrueckii ssp. lactis CNRZ327; B, L. delbrueckii ssp. bulgaricus ATCC 11842; red, enzyme functions identified in the respective genomes; highlighted in blue, carbohydrate metabolism pathways; highlighted in green, amino acid biosynthesis pathways.