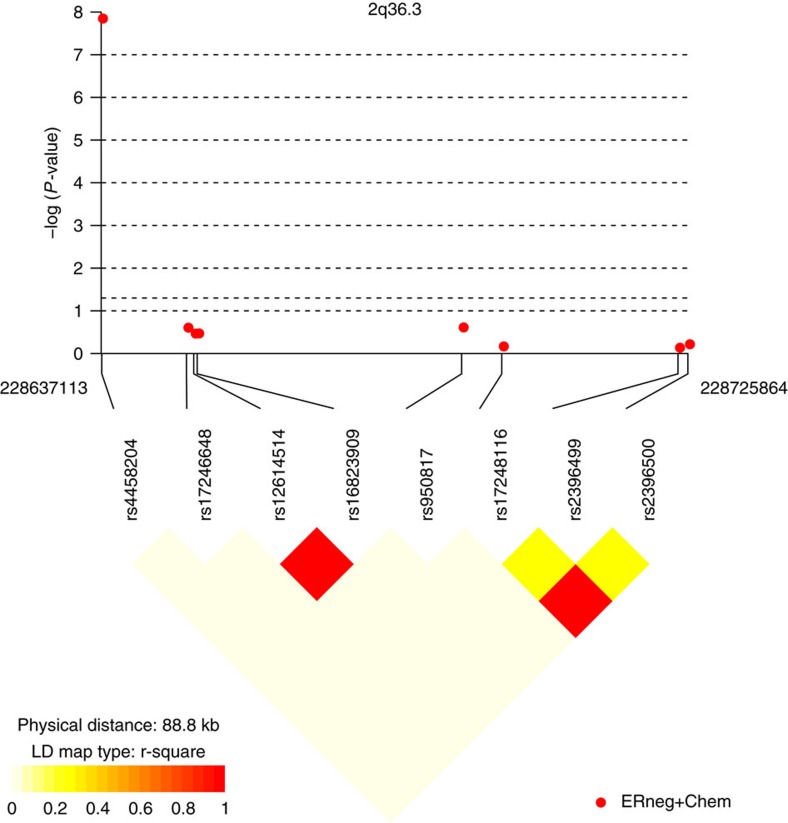
Figure 3. Linkage disequilibrium plot of SNPs within a 100-kb window flanking rs4458204 in the discovery phase.
The closest SNP flanking the left of rs4458204 is >9.5 Mb away. Chromosomal positions are based on NCBI build 36. P-values are derived from trend tests of association. Plotted using ‘snp.plotter’ package in R.

