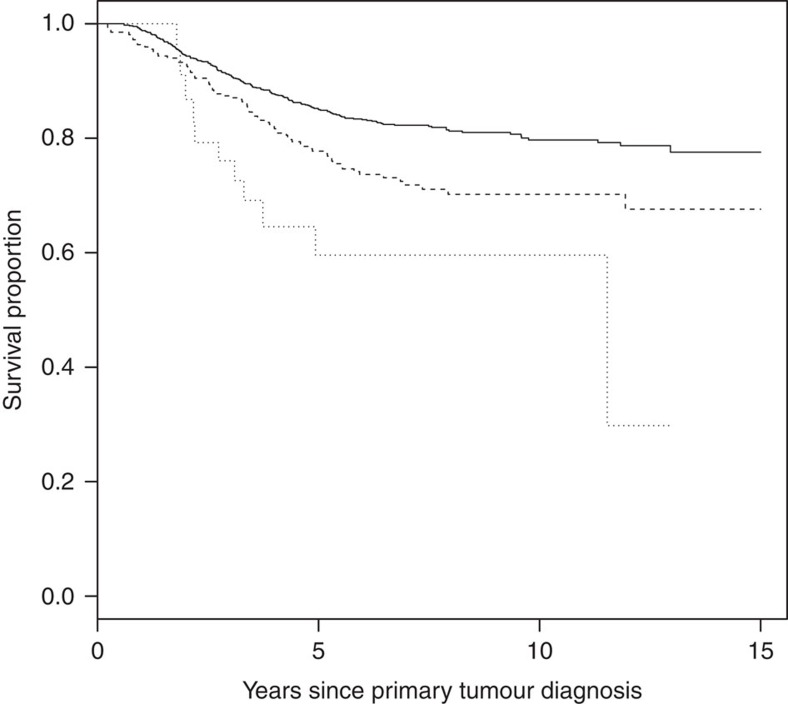
Figure 5. Kaplan-Meier survival curves of breast cancer-specific survival in estrogen receptor-negative patients treated with chemotherapy for rs4458204 in the discovery phase.
Analysis were adjusted only for time of blood draw and stratified by genotype. The p-value shown is based on the log-rank test. The number of events/n for each genotype are in parenthesis as follows rs4458204_GG (195/1415, single continuous line), rs4458204_AG (73/357, broken line) and rs4458204_AA (11/32, dotted line). The log rank P-value for this analysis was 3.18 x 10⁻⁶.

