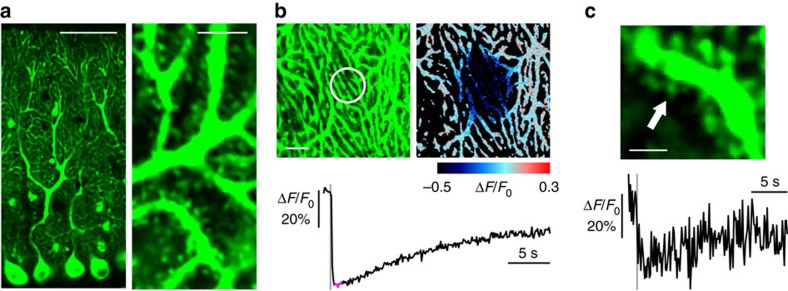
Figure 3. Activity-dependent ER Ca2+ dynamics in cerebellar Purkinje cells visualized with G-CEPIA1er.
(a) G-CEPIA1er-expressing Purkinje cells in the cerebellar slice. Scale bars, 50 μm (left) and 5 μm (right). (b) PF-induced ER Ca2+ dynamics in the dendrites of Purkinje cells. Time course of mean ΔF/F0 within the white circle (indicated in the left image) indicates fluorescence decrease upon PF inputs (10 stimuli at 100 Hz, grey line). The pseudo-colour image that is the average of 10 consecutive frames (indicated as magenta in the time course of ΔF/F0) show local dynamics of luminal Ca2+. Scale bar, 10 μm. (c) PF-induced response in single spine of Purkinje cells. Representative time course of ΔF/F0 within a spine indicated by the arrow. PF inputs (10 stimuli at 100 Hz, gray line) elicited ER Ca2+ release within the spine. Scale bar, 2 μm.

