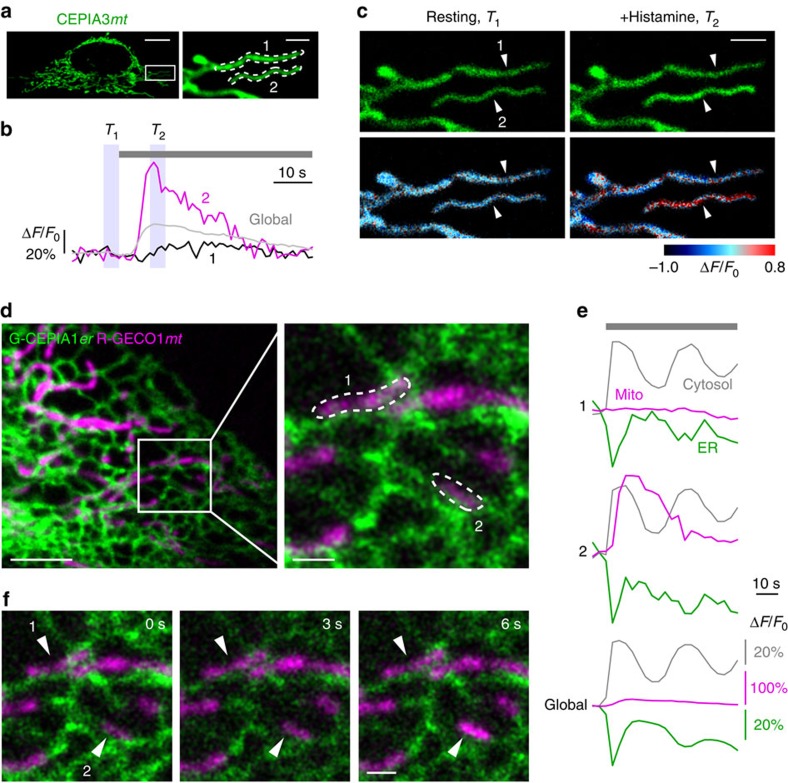
Figure 7. Subcellular heterogeneity of mitochondrial Ca2+ response.
(a) Fluorescence image of a CEPIA3mt-expressing HeLa cell. The area within the white box was expanded. Scale bars, 10 μm (left) and 2 μm (right). (b) Time courses of mitochondrial Ca2+ signal during 10 μM histamine application within the two regions of interest shown in a. Time course averaged over the entire cell was also shown (global). Averaged fluorescence images at resting state (T1, left blue box) and after histamine application (T2, right blue box) were indicated in c. (c) Upper, averaged fluorescence images at resting state (T1, left) and after histamine application (T2, right) as indicated in b. Lower, time-dependent changes in the fluorescence intensity were shown in pseudo-colour. Scale bar, 2 μm. (d) The fluorescence images of a HeLa cell expressing G-CEPIA1er (green) and mitochondria-localized R-GECO1 (R-GECO1mt, magenta). The area within the white box was expanded. Scale bars, 5 μm (left) and 1 μm (right). (e) Time courses of Ca2+ signal in the mitochondria, ER and cytosol in a HeLa cell stimulated with 10 μM histamine within the two regions of interest indicated in d. Time courses averaged over the entire cell were also shown (Global). (f) The images of R-GECO1mt (magenta) and G-CEPIA1er (green) at three time points were shown. Representative images of six cells. Scale bar, 1 μm.

