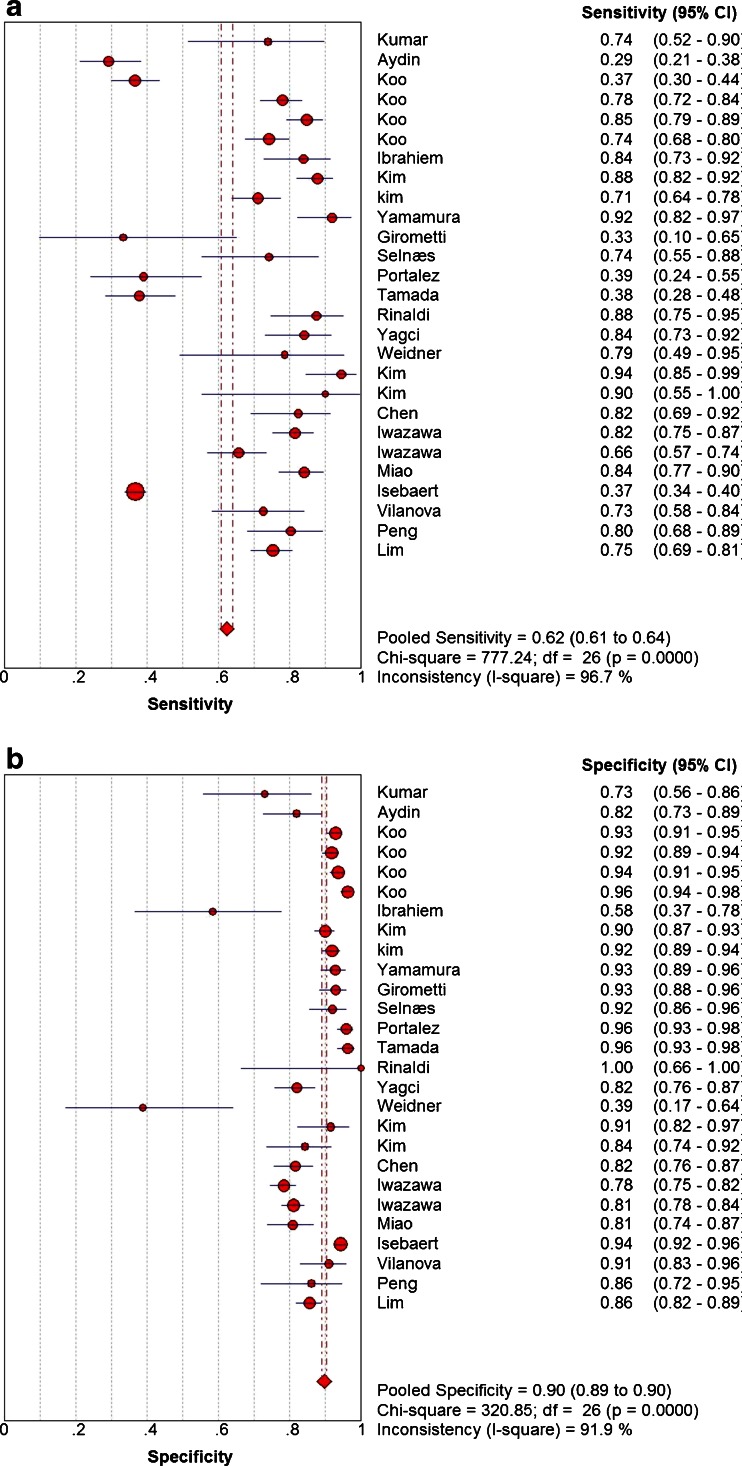
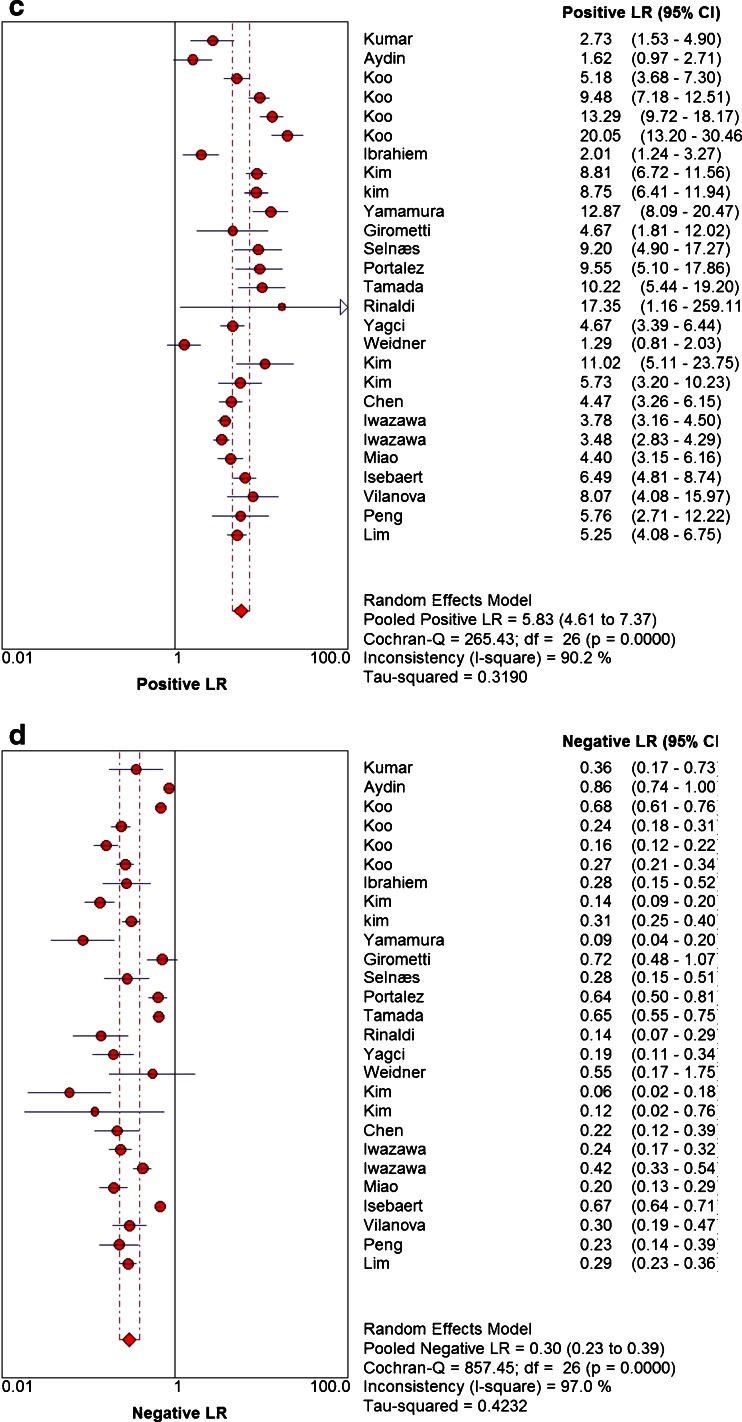
Fig. 2.
Forest plots of SEN (a), SPE (b), PLR (c) and NLR (d) of DWI in detecting PCa. The Q statistics and I 2 indexes of sensitivity and specificity suggested the presence of notable heterogeneity, and the diagnostic performance was summarized by using a random-effects coefficient binary regression model


