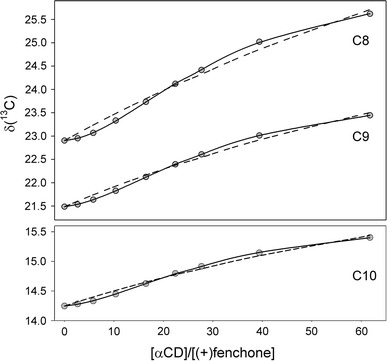
Fig. 3.

Experimental 13C chemical shifts (gray circles) measured for methyl carbons of (+)fenchone in NMR titration with αCD. Solid lines represent the best fit curves for the stepwise binding (complex stoichiometries 1:1 and 1:2). Dashed lines correspond to 1:1 complex stoichiometry
