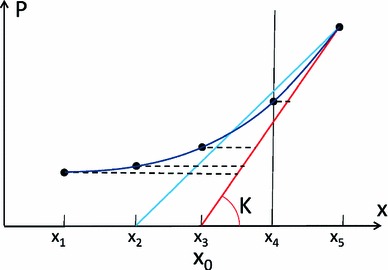
Fig. 2.

Illustration, in a pressure-displacement (P-x) curve, of the parameter estimation process. The result of a correct estimation of both stiffness and reference position is represented by drawing a tangent line (red line) for the P-x curve at the final measurement point, reaching the horizontal line of (essentially analogous to deflating from the end diastolic state to zero pressure for the LV model). The amount of active tension is proportional to the length of the 5 horizontal dashed lines at the 5 measurement points, because that is the amount of force needed to compress the spring from the red line (pure passive behavior) to the corresponding positions of the P-x curve. The blue line represents the scenario of an incorrect estimation of the reference position, where the AT estimated at measurement point 4 (denoted by the dash vertical line) will be negative (note that the blue line falls to the left of the P-x curve, i.e., negative AT is needed to stretch the spring to match the P-x curve)
