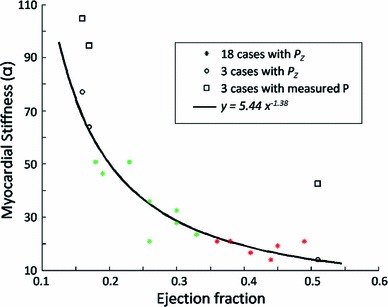
Fig. 9.

Regression line between stiffness and EF in the clinical cases (18 cine-only cases and 3 cases previously reported in Xi et al. 2013), when estimated using the literature surrogate . The ground-truth (estimated using the measured pressure) of the three cases are plotted in box marks. The green star marks correspond to the healthy cases among the 18 cine-only cases, while the red stars marks correspond to the diseased ones
