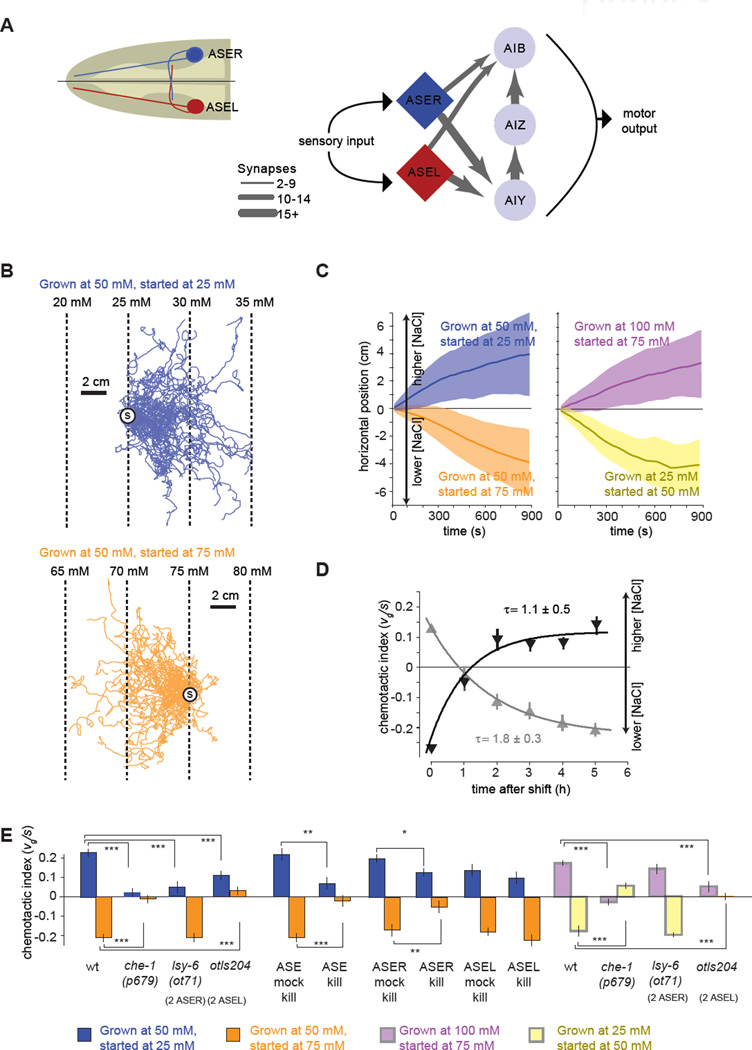
Figure 1. C. elegans performs bidirectional chemotaxis in linear NaCl gradients.
(A) Simplified synaptic connections for the salt-sensing ASE neurons.
(B) Navigation trajectories of 50 wild-type N2 animals on linear NaCl gradients with 2 mM NaCl/cm steepness. Animals were grown at 50 mM NaCl and started at 25 mM (blue) or 75 mM (orange). Trajectories are aligned to have the same starting point (circle with S) for presentation purposes.
(C) Average horizontal position of worms grown at specific salt concentrations and started at different salt concentrations on 2 mM/cM NaCl steepness linear gradients as shown in (B). Solid lines and shading indicate the mean ±1 STD of horizontal displacement from the start point over time measured over the trajectories of individual worms. Positive horizontal displacement is towards higher salt concentrations in all panels. n > 280 animals for each measurement.
(D) Upshift (dark grey) and downshift (light grey) of navigational indexes for wild-type N2 animals grown overnight at one salt concentration (50 or 100 mM NaCl, respectively) and then shifted to a new salt concentration (100 mM or 50 mM NaCl, respectively) for a specified time interval before being placed on a 2 mM/cm linear NaCl gradient at 75 mM (n>40 animals for each measurement). The chemotactic index, the ratio between the velocity of each trajectory in the horizontal direction divided by the crawling speed along each trajectory, 〈vg〉/ 〈s〉, was computed. Each data point represents mean ± SEM. Solid lines represent least squares fits to exponential time courses. The time constant of each exponential fit ± SD is shown.
(E) Chemotactic indexes of wild type, mutant, ASE laser killed animals, and ASE mock surgical controls in linear 2 mM/cm NaCl gradients. ANOVA Tukey-Kramer post hoc was used to compare wild type and mutants. Student's t-test was used to compare laser killed animals with mock surgical controls. *** p<0.0005; ** p<0.005. n>20 animals for each measurement. Data points represent mean ± SEM.

