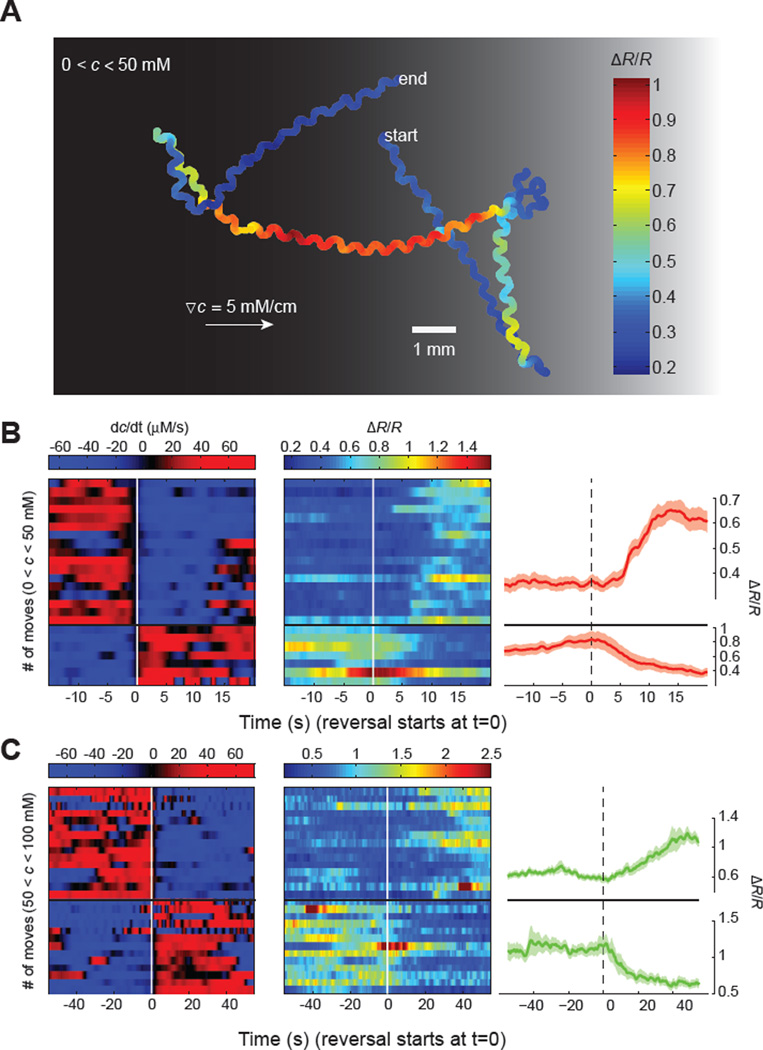
Figure 4. ASER calcium imaging in freely navigating worms.
(A) Representative ASER motion trajectory as well as its ratiometric calcium signal (R) in a worm freely navigating a linear salt gradient. ASER exhibited higher level of calcium activity when the worm moved down the gradient (towards left).
(B, C) Heat map and mean values of ASER calcium dynamics when C. elegans navigates below (B) or above (C) the setpoint (50 mM NaCl). Left and middle panels: temporal salt gradient experienced by worms during reversals and/or turns (left panels, rows) and the corresponding calcium signals in ASER (middle panels). Right panels: mean values of ASER ratiometric calcium signals during transitions from moving up the gradient (dC/dt > 0) to moving down the gradient (dC/dt < 0) and vice versa. 24 events from n =10 animals (B) and 28 events from n = 10 animals (C), mean ± SEM.

