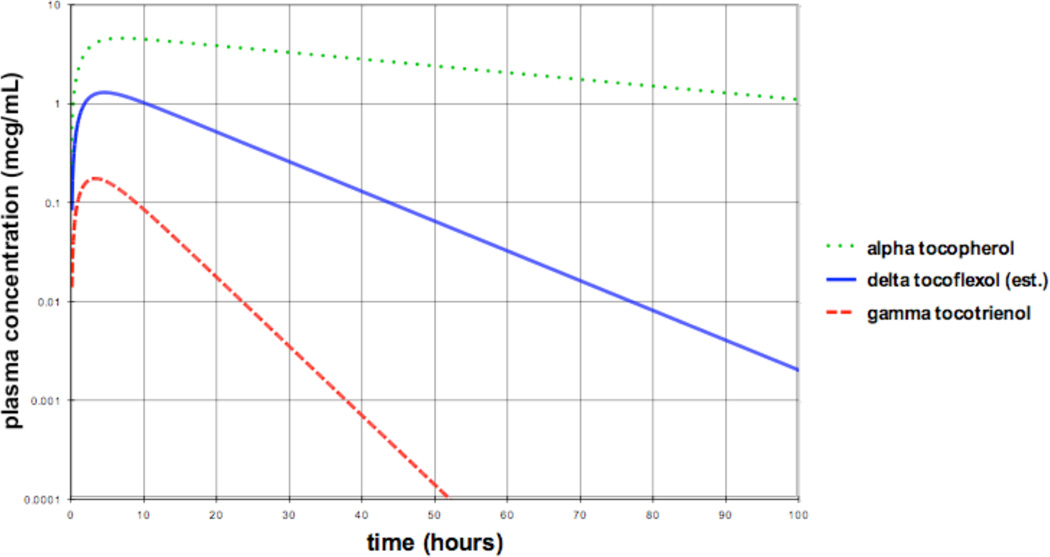
Fig. 10.
Estimated time course of δ-tocoflexol plasma concentration, as compared to the α-tocopherol and γ-tocotrienol plasma concentrations that would occur for equal oral doses of each compound. The δ-tocoflexol curve is based on a half-life estimated to be 38% of that of α-tocopherol and an oral bioavailability F estimated to be midway between α-tocopherol and γ-tocotrienol.

