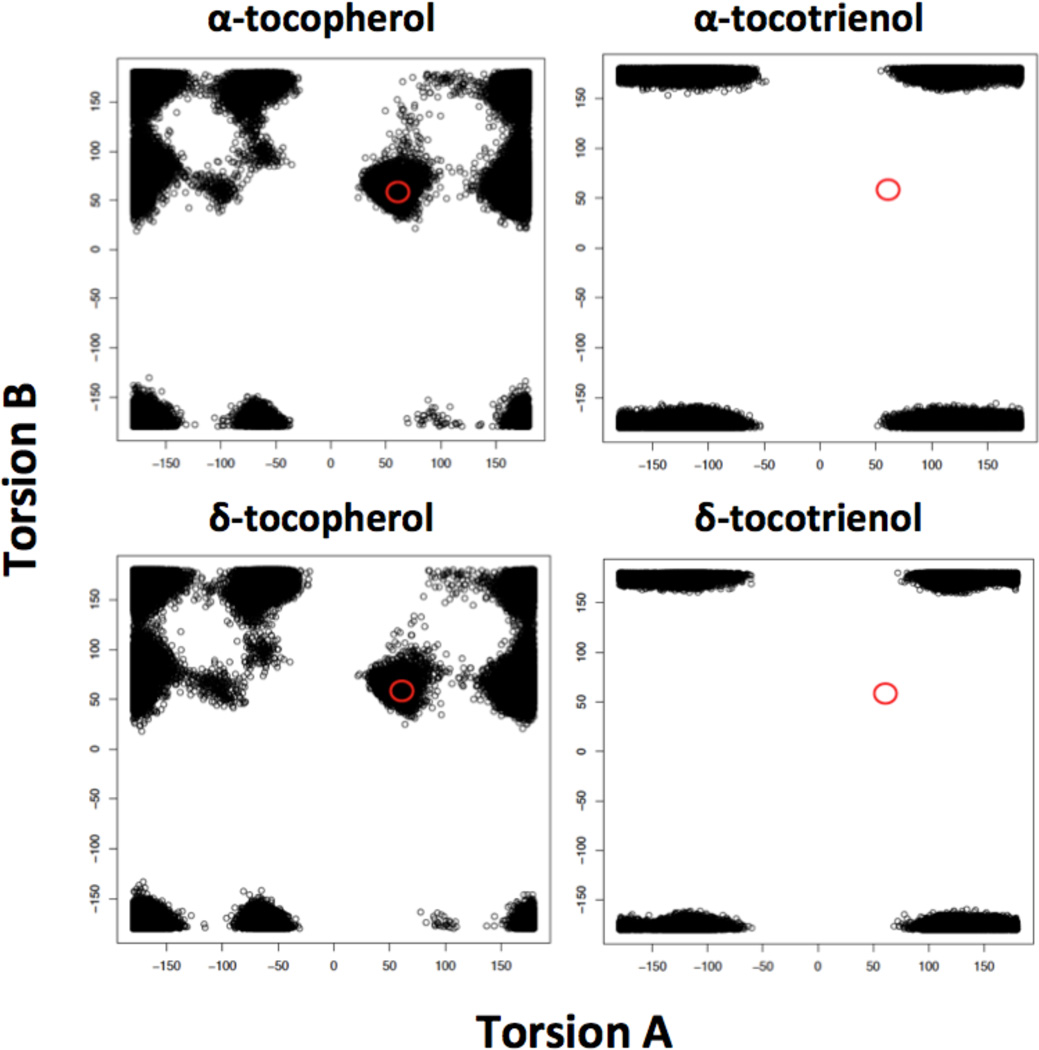
Fig. 6.
Molecular dynamics-based screening accurately discriminates between strong ATTP binding molecules and weak ATTP binding molecules. The figure shows the distribution of conformations around torsion angles A and B for 100,000 conformations of each molecule. In molecules with favorable conformations for binding to ATTP, such as the tocopherols, both torsion angles must be in the region delineated by the circles in the figures. Tocotrienols show no conformations in this region.

