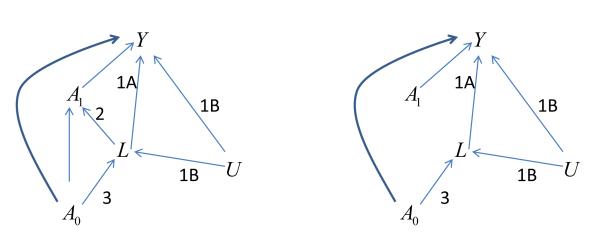
Figure 1.
Causal diagrams depicting relationships among key variables, illustrating the issue of time-dependent confounding.
a: Actual relationships in population, where the intermediate variable L is a time-dependent confounder.
b: Relationships in the pseudo-population created by weighting (condition 2 is removed)
A0: Initial treatment
A1: Subsequent treatment
L: Intermediate variable (disease activity)
Y: Outcome (visual acuity)
U: Common cause (possibly unmeasured) of L and Y
Conditions 1 Covariate L is independent predictor of outcome Y because of 1a (effect of L on Y) and/or 1b (unmeasured common cause U of L and Y)
2 Covariate L influences subsequent treatment A1
3 Covariate L is influenced by earlier treatment A0.

