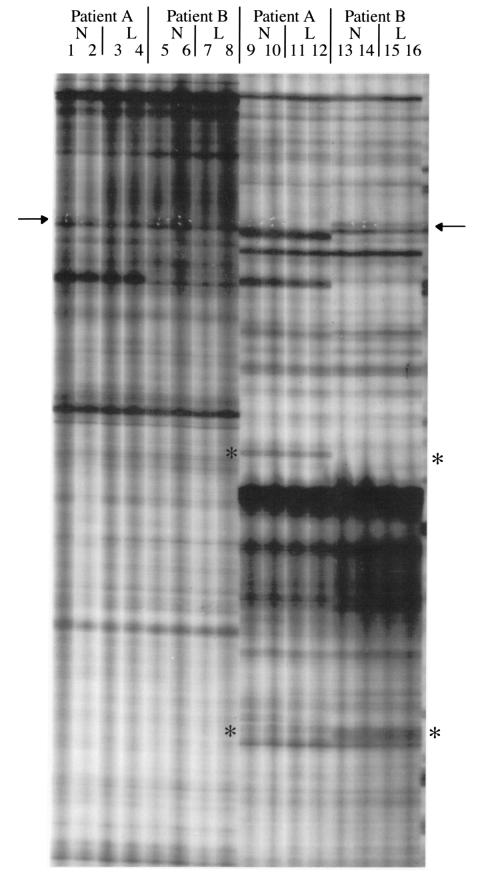
Figure 1.
Lanes 1–8 and 9–16 show an example of differential display of RNA from scleroderma biopsy fibroblasts using two primer pairs. The 5′ primer for lanes 1–8 was RDS3, 5′-GAATTCACCAGAC; the 5′ primer for lanes 9–16 was RDS4, 5′-GAATTCGCTCACT; the 3′ primer for all samples shown is the same: HT11A, 5′-AAGCTTTTTTTTTTTA. Duplicate samples of RNA from nonlesional (N) and lesional (L) fibroblasts are shown in the designated lanes. Asterisks represent differential display bands, which are uniformly represented in nonlesional and lesional tissue from a given patient, but which differ between patients. The PN1 band is shown at the arrow and is amplified more in the nonlesional tissue (lanes 13 and 14) than in the lesional (lanes 15 and 16). White puncture marks in the x-ray film, used to define the band on the gel before cloning, are visible for PN1. Fortuitously, PN1 was amplified in all lanes where the 3′ primer HT11A was used, regardless of the sequence of the 5′ primer. We subsequently showed that the band was amplified by using the primer HT11A at both ends of the template (data not shown).

