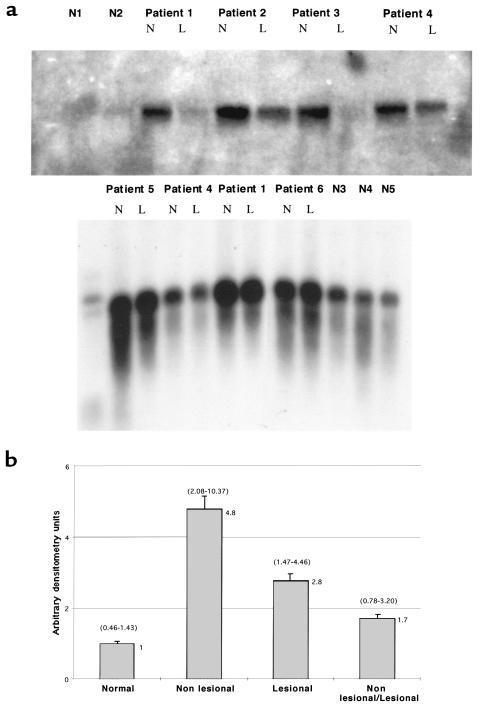
Figure 3.
(a) Northern blots using total RNA isolated from human dermal fibroblasts at low passage from scleroderma patients or healthy volunteers. Nonlesional (N) and lesional (L) fibroblast RNA is shown for each of six independent patients along with site-matched and age-matched biopsy fibroblasts from five normal individuals. Size markers are visible in the left lane of the bottom panel. Overexpression of PN1 of the correct size is shown in the patients compared with the normal individuals. (b) Summary of several Northern analyses performed as in a, incorporating the data from nonlesional and lesional samples from each of 10 patients and site-matched, age-matched samples from seven healthy volunteers. The graph shows the PN1 mRNA ratios for nonlesional and lesional tissues compared with normal tissue (second and third bars). The last bar is the mean ratio for PN1 mRNA from paired nonlesional and lesional fibroblasts. Error bars represent the SEM. The actual mean value represented by each bar is at the top right of the bar. The ranges for each bar are represented in parentheses above the respective bar. PN1 expression levels were quantitated from nonsaturated bands on x-ray film by densitometry and normalized for the amount of RNA loaded in each lane (see Methods). To compare PN1 expression values from different blots, PN1 expression values for normal individuals on a given blot were averaged, and that value was arbitrarily set to 1.0. PN1 values for each of the scleroderma samples were then determined as a factor of the mean of the normal values for each blot. Data from four Northern analyses were combined. Some of the fibroblast lines were assayed multiple times using independent RNA samples from cultures of the same line. Four of the 10 scleroderma lesional and nonlesional lines were each assayed twice; one pair of lesional and nonlesional lines was assayed three times; and two of the normal lines were assayed twice. Multiple values obtained on a single patient were averaged before use in calculating data in the figure.

