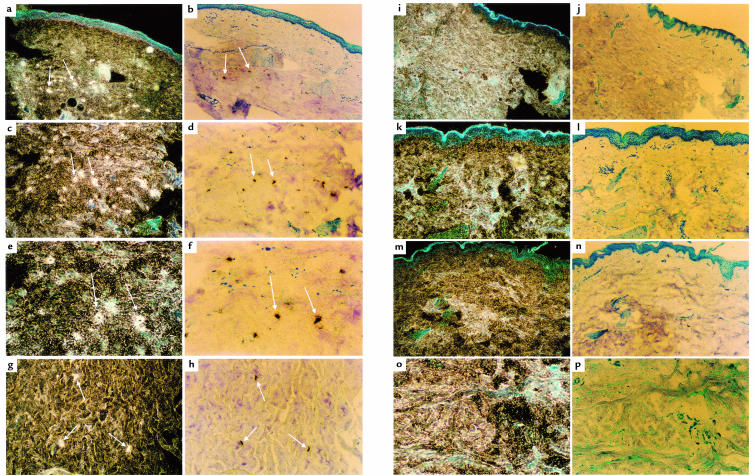
Figure 6.
Dark-field and bright-field views of in situ hybridization of scleroderma (a–h) and healthy (i–p) skin, using 35S-labeled antisense PN1 as a probe (see Methods). Pairs of dark-field and bright-field views of each sample are adjacent. A sample of the PN1-expressing positive cells in scleroderma skin (a–h) are identified with white arrows. a, b, i, and j were photographed using a ×6 objective. In these panels, and in some others, the blue uppermost layer is the epidermis. e–h show the deeper, reticular dermis. Blue-stained nuclei in the dermis can be seen in several of the bright-field views. White grains in the dark-field views correspond to the dark-stained cells in the bright-field views and represent hybridization to PN1 mRNA. a and b (×6) represent scleroderma patient P9; c and d (×10) and e and f (×20) represent patient P7; g and h (×10) represent patient P10. i–p represent four normal samples: i and j (×6) represent N11; k and l (×10) represent N10; m and n (×10) represent N7; o and p (×20) represent N9.

