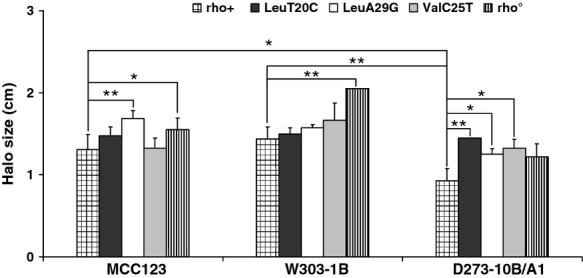
Figure 6.

Hydrogen peroxide sensitivity of WT, rho° and mt tRNA mutants in MCC123, W303-1B, and D273-10B/A1 nuclear backgrounds. Comparison of the halo sizes of H2O2 growth inhibition (disks saturated with 50 mM H2O2) obtained by plating 2 × 10⁹ cells from exponential cultures. The values of halo sizes, expressed in cm as halo radius after subtraction of disk radius, are means (with standard deviations) obtained from three independent experiments. *(p < 0.05) and **(p < 0.01) indicate the statistical significance of differences calculated by comparing the strains linked by the bars.
