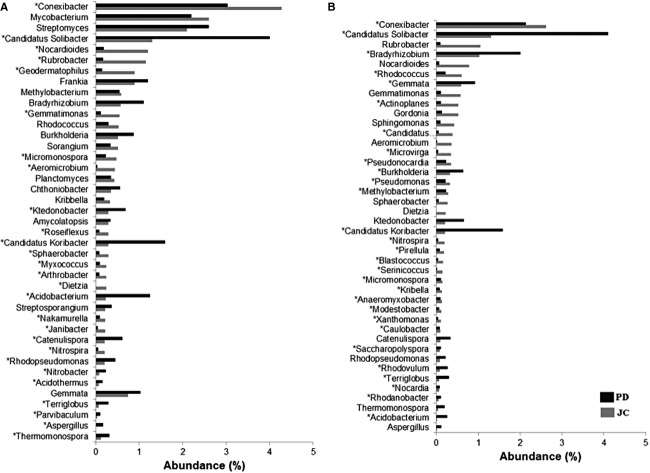
Figure 2.
Comparative taxonomic profile of the PD and JC samples at genus level, computed by MG-RAST (A) and MEGAN (B). The twenty most abundant genera found in each samples are shown. *Significant differences between PD and JC samples (P < 0.05, difference between the proportions >1% and twofold of ratio between the proportions).

