
Figure 3.
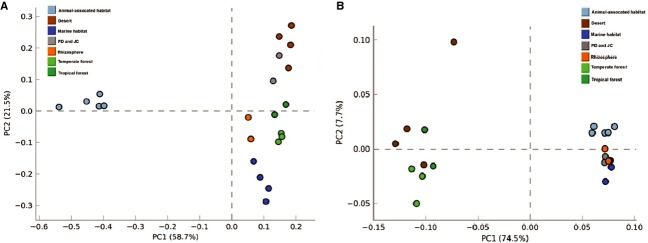
Trends in the PD and JC taxonomy for the class level (A) and for SEED subsystems at level 1 (B) examined using Principal Component Analysis (PCA) through the STAMP software, based on multiple group analysis, applying ANOVA test, Games–Howell post hoc test for confidence interval method and Benjamin–Hochberg FDR for correction.