
Figure 8.
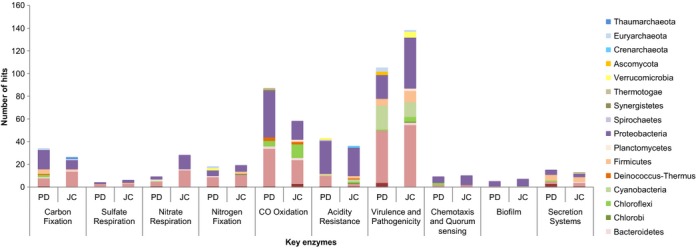
Comparison between PD and JC samples for key enzymes coding genes of distinct metabolic pathways: Carbon Fixation (abfD, cbbQ, cbbO, cbbX, cbbR), Sulfate Respiration (dsrA), Nitrate Respiration (nirK, nirS, narG, narH, napA, napB, napC, nosZ), Nitrogen Fixation (fixA, fixB, fixC, nifA, nifH), CO Oxidation (coxL, coxM, coxS), Acidity Resistance (idhD, atpA, aldB, cfA, groEL, pstS, phoBDRSU), Virulence and Pathogenicity (katG, aroG, ohr, cpkA, prfA, palFA, sdh1, mpg1, pth11, acr1, ace1, pelA, cut1, pth3, pth8, pkS1-15, tri5, fsr1, magB, mgv1, mps1, pmk1), Chemotaxis and Quorum sensing (pilG, pilH, pilJ), Biofilm (hnsP), and Secretion Systems (TIII Type – escV, pscJ, fliI, flhA/TIV Type – virB4, virB11, cpaF).