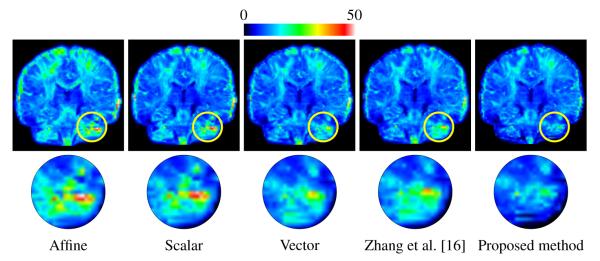
Fig. 1.

From top to bottom: the mean RMS error images and the close-ups of the regions marked by yellow circles. Note that the images were not sliced to show left-right symmetry.

From top to bottom: the mean RMS error images and the close-ups of the regions marked by yellow circles. Note that the images were not sliced to show left-right symmetry.