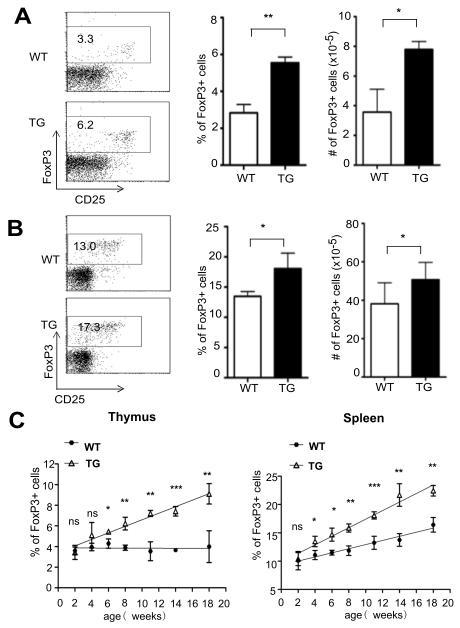
Figure 1. Id1 transgenic mice accumulate higher levels of Treg cells.
Treg cells in the thymus (A) and spleen (B) of 8-week-old littermate wild type (WT) and CD4-Id1tg (TG) mice were measured by intracellular staining for FoxP3. Representative FACS plots of FoxP3 and CD25 expression in CD4 single positive T cells are shown on the left. Numbers in the gates show the percentage. The average percentage and number of FoxP3+ cells in 6-8 weeks old WT and TG littermates (n=4) analyzed in independent experiments are shown on the right. Results are presented as mean with SD. (C). FoxP3 expression in thymus (left) and spleen (right) of mice of different ages were examined. Each time point represents the average of 4 WT or TG littermates analyzed in independent experiments. The percentages of FoxP3+ cells in CD4+ cells are shown as mean with SD. The time course was drawn based on linear regression analysis. Unpaired Student’s t tests were performed to determine the p values at different time points. ***p<0.001; **p<0.01; *p<0.05; ns, not significant. In addition, the statistical significance of the difference between WT and TG over the time course was also determined using two-way Anova. The p value (<0.001) indicates significant interaction between the genotype and age.

