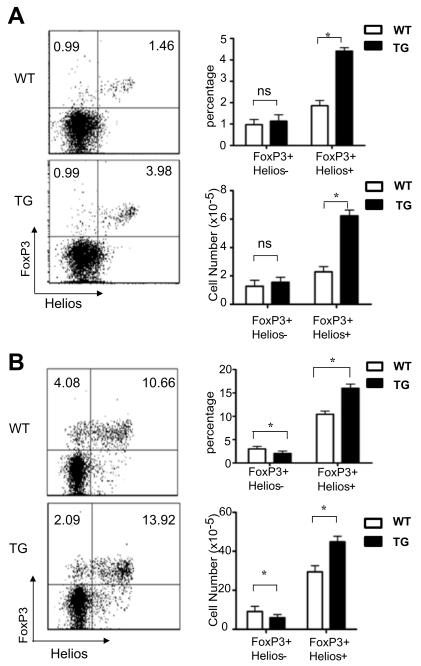
Figure 2. Id1 transgenic mice have more thymus-derived Treg cells.
Lymphocytes from the thymus (A) and spleen (B) of 8-week-old wild type (WT) and CD4-Id1tg (TG) littermates were analyzed by intracellular staining for FoxP3 and Helios. Representative FACS plots of FoxP3 and Helios expression in CD4 single positive T cells are shown on the left. The average percentage and number of FoxP3+ cells WT and TG littermates (n=4) analyzed in three independent experiments are shown on the right. Results are presented as mean with SD. *p<0.05; ns, not significant.

