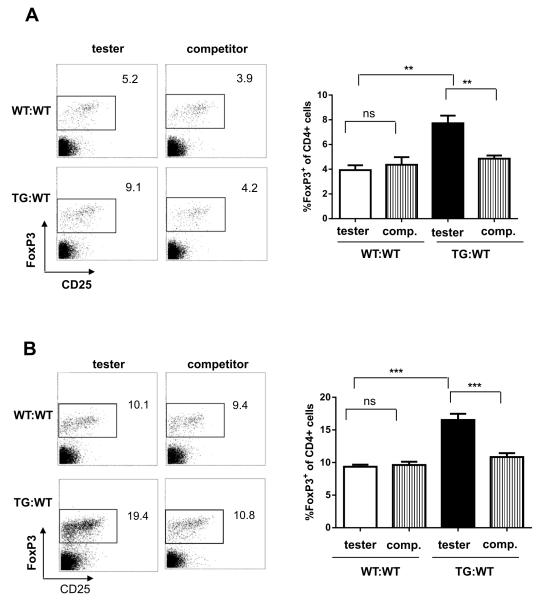
Figure 4. T cell intrinsic-effect of Id1 expression on Treg production.
Bone marrow cells from CD45.1+ wild-type mice were used as competitors (comp.) and mixed at a 1:1 ratio with CD45.2+ bone marrow cells from wild-type or Id1tg mice (tester). Cells were injected into lethally irradiated CD45.1+ recipient mice. The thymus (A) and spleen (B) of the mixed bone marrow chimeras were analyzed by flow cytometry 12 weeks after transplantation. Representative FACS plots of FoxP3 and CD25 expression in CD4 single positive T cells are shown on the left. Data from cohorts of 7 mice are presented as mean with SD on the right. ***p<0.001; **p<0.01; ns, not significant.

