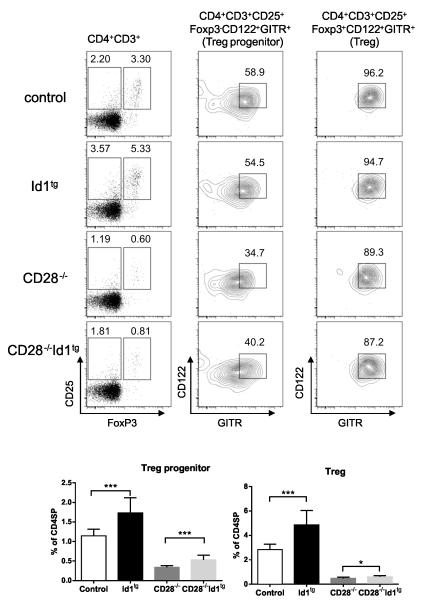
Figure 6. Id1 expression augments the frequency of Treg precursors in wild type and CD28−/− mice.
Thymocytes from mice of indicated genotypes were stained with antibodies against CD3, CD4, CD8, CD25, CD122 and GITR followed by intracellular staining for FoxP3. CD4+CD3+ cells were analyzed for expression of CD25 and FoxP3. CD25+FoxP3− or CD25+FoxP3+ cells (defining Treg precursor or Treg) were then separately examined for CD122 and GITR levels. Representative plots are shown on the top. Data shown at the bottom are the average percentages from control (WT or CD28+/− n=11), Id1tg (n=11), CD28−/− (n=6) and CD28−/−Id1tg (n=14) analyzed in 4 independent experiments. Error bar shows SD. Unpaired Student’s t test was performed to determine the significance between two indicated groups. ****p<0.0001; ***p<0.001; **p<0.01; *p<0.05. In addition, the one-way Anova analysis indicates a statistical significance among the four groups (p< 0.0001).

