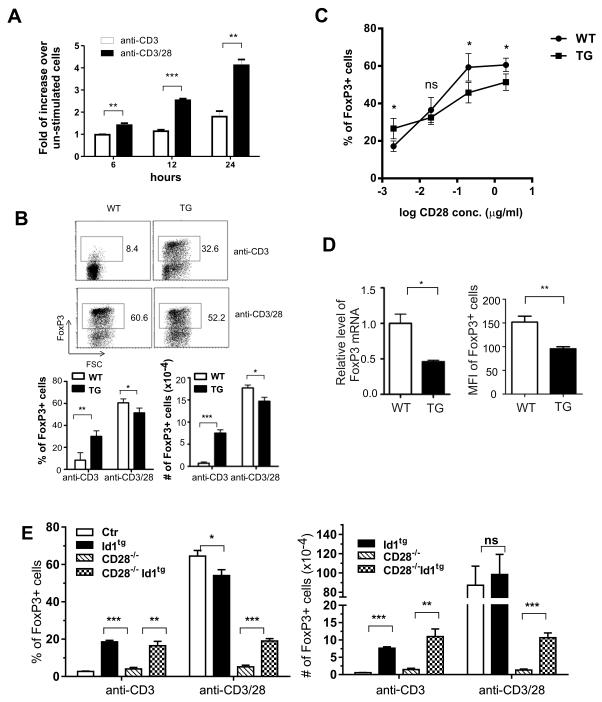
Figure 7. Id1 expression promotes in vitro Treg induction of naïve CD4+ T cells.
(A) Wild type CD4+CD62LhiCD44loCD25− naïve T cells were stimulated with anti-CD3 (1μg/ml), with or without anti-CD28 (2 μg/ml), for indicated hours. Id3 levels were normalized against those of GAPDH. The graph shows the increase in normalized Id3 expression after stimulation for indicated length of time over that in un-stimulated cells. ***p<0.001; **p<0.01. (B) Naïve T cells (200,000 cells) from the lymph nodes of wild type and Id1 transgenic mice were cultured on plated-bound anti-CD3 (1 μg/ml) in the medium containing 1 ng/ml TGFβ plus or minus 2 μg/ml of anti-CD28. Three days later, FoxP3 expression was measured and plotted against forward scatter. Average percentages (left) and number (right) of FoxP3+ cells were calculated from data of 4 independent experiments. Results are presented below the FACS plots as mean with SD. (C) Different concentrations of anti-CD28 ranging from 0.002 μg/ml to 2 μg/ml were added in cultures described for (B). The average percentages of FoxP3+ cells at each concentration from 4 independent experiments were plotted against CD28 concentration in log scale. Results are presented as mean with SD. Unpaired Student’s t tests were performed to determine the p values at different concentrations. *p<0.05; ns, not significant. In addition, the statistical significance of the difference between WT and TG with different concentration of anti-CD28 was also determined using two-way Anova. The p value (<0.001) indicates significant interaction between the genotype and anti-CD28 concentration. (D) Id1 inhibits FoxP3 expression. Left: WT and TG naïve CD4 cells were cultured with 1 μg/ml anti-CD3 and 1 μg/ml CD28 plus 0.25 ng/ml TGFβ for 12 hours and total RNA was isolated from the cells. Levels of FoxP3 and GAPDH mRNA were measured using quantitative RT-PCR. FoxP3 levels were normalized against those of GAPDH. The graph shows the normalized FoxP3 level relative to that in WT cells, which is a representative of three independent experiments. Right: Treg differentiation cultures were set up with 1 μg/ml anti-CD3, 2 μg/ml anti-CD28 and 0.25 ng/ml TGFβ. Levels of FoxP3 expression were measured by determining the mean fluorescence intensity (MFI) of Foxp3+ cells. Results are presented as mean with SD of data from 3 independent experiments.**p<0.01; *p<0.05. (E) Naïve T cells from the lymph nodes of mice of the indicated genotypes were cultured and analyzed as described for (B). Average percentages and numbers of FoxP3+ cells produced (n=4) are shown as mean with SD and are representative for 5 independent experiments.

