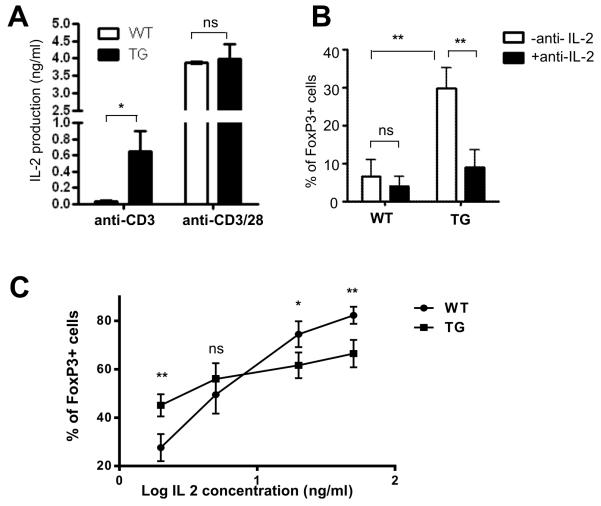
Figure 8. Elevated IL-2 contributes to the augmented Treg induction of Id1-expressing cells in the absence of anti-CD28 co-stimulation.
(A) ELISA was used to measure IL-2 levels in the supernatants collected 48 hours after culturing indicated naïve T cells with anti-CD3 and TGFβ with or without anti-CD28. The experiment was set up in triplicates and repeated 3 times. Results are presented as mean with SD. (B) Percentage of FoxP3+ cells in cultures of WT and TG naïve T cells in the presence of anti-CD3 and TGFβ supplemented with or without anti-IL-2. Results from 4 independent experiments are presented as mean with SD. (C) IL-2 at different concentrations ranging from 2 ng/ml to 50 ng/ml was added to the cultures of WT and TG naïve T cells in the presence of anti-CD3 and TGFβ. Average percentage of FoxP3+ cells for each concentration from 4 independent experiments are shown as mean with SD. Unpaired Student’s t tests were performed to determine the p values at different concentrations. **p<0.01; *p<0.05; ns, not significant. In addition, the statistical significance of the difference between WT and TG with different concentration of IL-2 was also determined using two-way Anova. The p value (<0.001) indicates significant interaction between the genotype and IL-2 concentration.

