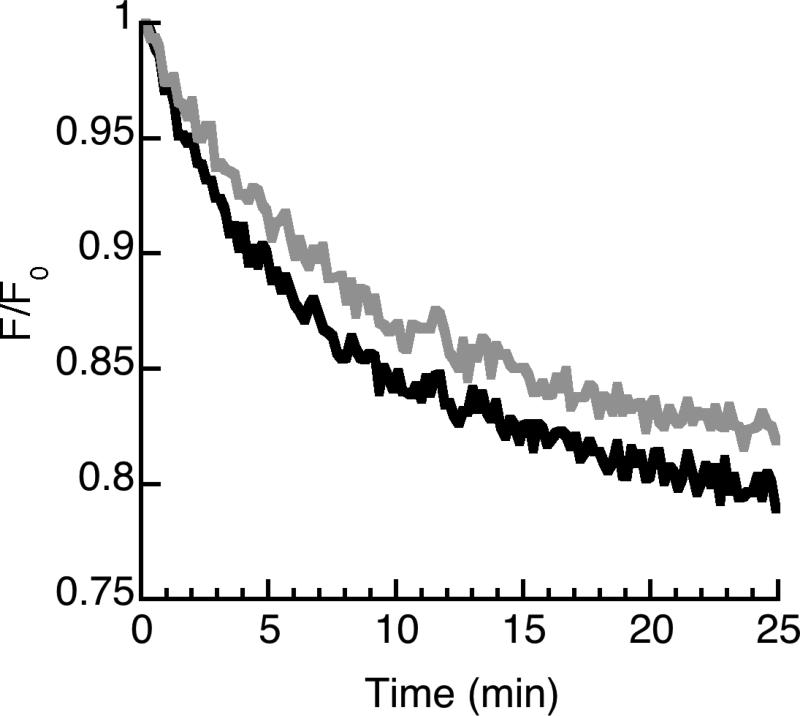
Figure 4.
Representative measurement of HipC translocation into lipid vesicles using an encapsulated trypsin assay. Peptide was exposed to lipid vesicles containing trypsin. Data are shown as the FRET signal at 525 nm (black) relative to the initial fluorescent signal (F/Fo). In the control trace (gray), peptides were exposed to vesicles containing both trypsin and trypsin inhibitor to control for incomplete inhibition of trypsin outside the vesicle under experimental conditions. The lower fluorescence for the experimental condition denotes translocation.

