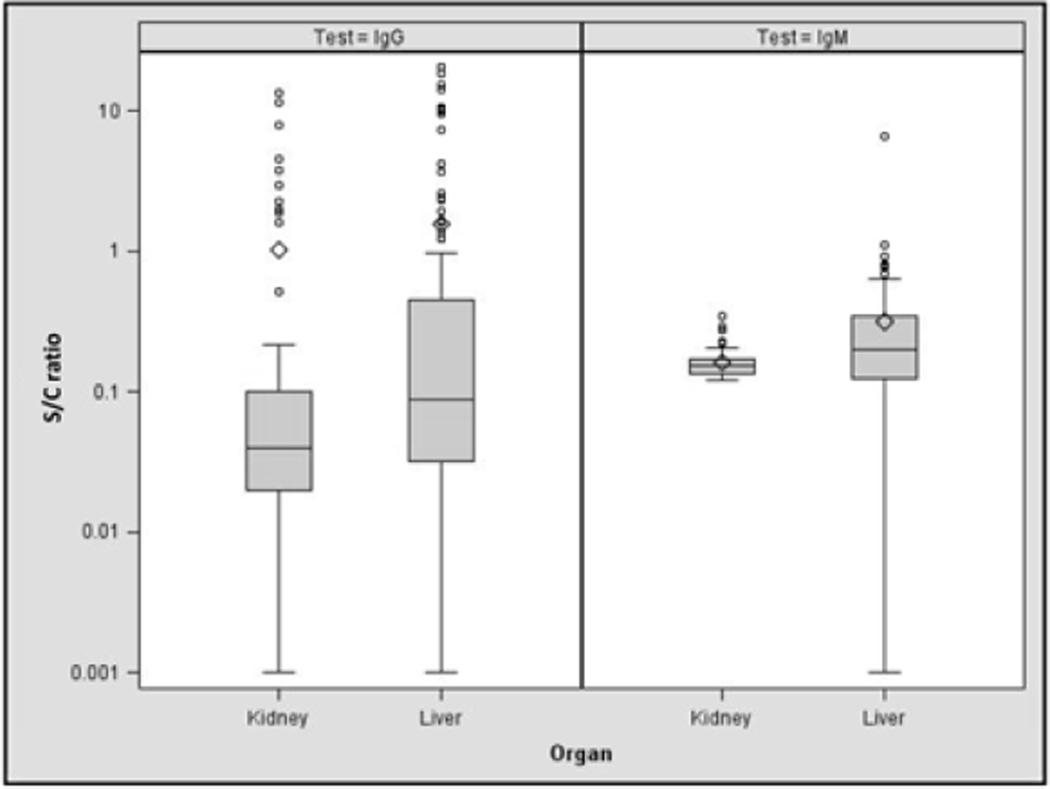
Figure 1.
Signal-cutoff ratios for HIV-infected liver and kidney transplant candidates. In the box and whisker plots, the line inside the box indicates the median value whereas the bottom and top edges of the box indicate the intraquartile range. Outlier values are shown in circles; means are indicated by diamonds.

